Debugging Programs
| I l @ ve RuBoard |
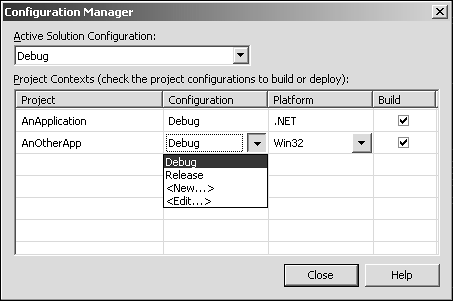
| Even the greatest programmers make mistakes, so a good debugger is of paramount importance. Debugging with Visual Studio is very easy, and you have a wide range of options for stopping programs and examining code. The simplest is to debug code as you are building it. The debugger can also trap an unhandled error condition and attach itself to the offending process, or you can explicitly attach the debugger to a process. Let's examine the simple case first. To debug the program, it must be built in Debug mode. Select this using the project Configuration Manager selectable from the main Debug menu. Figure 1.5.21 shows the Configuration Manager and illustrates the use of the drop-down menus for selecting the build configuration currently in use. Figure 1.5.21. The project Configuration Manager dialog. After the debug configuration is selected, you are ready to decide where you want the program to stop. This is accomplished by setting a breakpoint. You can do this by selecting the line of code where you want to stop and pressing F9. A red mark will appear in the margin of the code editor to show that the breakpoint is active. You can also set a breakpoint by clicking the mouse in the gray left margin of the editing window, or by pressing Ctrl+B. Earlier in this chapter, we mentioned the Breakpoints pane that is found near the task window. To activate this pane, select Debug, Windows, Breakpoints or press Ctrl+Alt+B.
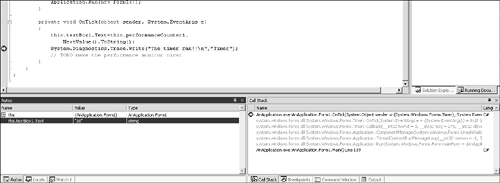
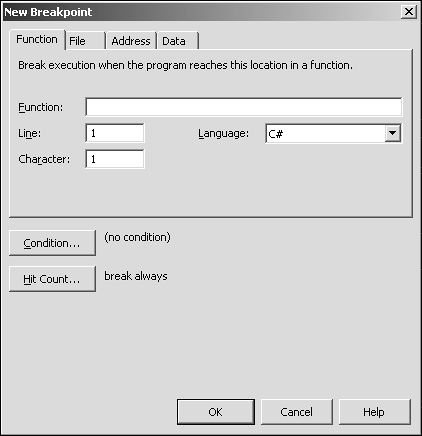
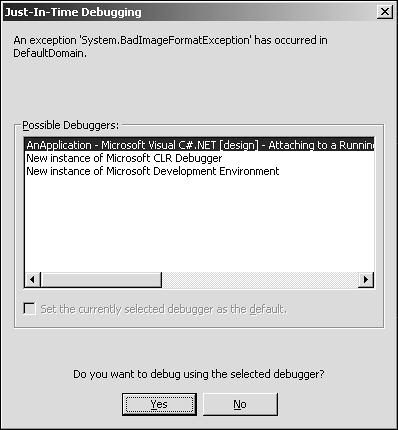
After a breakpoint has been successfully set, the program can be run with the expectation of hitting the break. Press F5 to execute the code in debug mode. Advanced Breakpoint SettingsSometimes you need more than just a place to stop, so the breakpoints in VS.NET can also be set to trigger after so many passes through the breakpoint or when some condition is met. To create a new breakpoint, select a line of code and press F9 or Ctrl+B. F9 will automatically fill in the function and line of code where you want to stop. Ctrl+B will require you to fill this information in manually. When you use Ctrl+B, you will see the New Breakpoint dialog, as shown in Figure 1.5.23. Figure 1.5.23. Code stopped at a breakpoint. Figure 1.5.22. The New Breakpoint dialog. There are two buttons on this dialog, Condition and Hit Count. To edit a breakpoint that has already been set, find the breakpoint in the Breakpoints pane and right-click it. This action lets you select Properties from a context menu that brings up a Breakpoint edit box that has similar options. Conditional BreakpointsChoosing this option allows you to decide when you want the program to halt, depending on one condition or another. For example, you might want to have the program stop when a variable reaches a specific value if it has changed since the last time through the breakpoint. Hit CountsThis option allows the breakpoint to execute as normal until it has been hit a certain number of times. You can set it to Break Always, Break When Hit-Count is Equal to a Specific Value, Break When the Hit-Count is a Multiple of Some Number, or Break When the Hit-Count is Greater Than or Equal To a Value. Combining these options is possible so you can say you want the program to break on the fifth pass through the breakpoint, on the condition that a variable is greater than or equal to fourteen. What to Do When the Code Is PausedSome old familiar options are available to the programmer when code is paused. You can examine variables , step through lines of code one at time, and even send direct commands to objects in the application via the command window. Figure 1.5.24 shows a timer service handler stopped at a breakpoint. It also shows the local variables that can be edited or examined and the call stack for the application at that point. Figure 1.5.24. The Just-In-Time Debugging dialog. A feature that will be familiar to Visual Basic programmers, but probably not to C++ programmers, is the command window. This pane, located in the bottom-right tab bar when debugging, allows you to write commands directly to objects that are halted in the debugger. In the case of the previous timer code, for example, it is possible to type in this.timer1.Enabled = false<enter> and the timer will be disabled. If F5 was pressed to run the program from the breakpoint again, the breakpoint in the timer would no longer be hit. Using the command window, you can easily change the contents or configuration of objects in the code to try out scenarios that help you fix your bugs . Attaching the Debugger to a ProcessThis is a useful feature if you're debugging a collection of applications from the same solution or perhaps debugging a DLL. You can run the application, start the debugger, and chose to break into the application by stopping it. You will be asked what kind of application you want to debug. Common choices are a CLR-based app, a Microsoft T-SQL, a native code program, possibly C++, and a script. Attaching to another process can also be done on a remote machine if you have permission to access it. JIT DebuggingJust in time (JIT) debugging occurs when a piece of code throws an unhandled exception and is not attached to a debugger. You have several options for debugging when this happens. You will be presented with a dialog that allows you to choose which debugger you want to use. Note that even if you don't have Visual Studio installed, you will have debugging options. If you do have Visual Studio installed, though, it's best to choose this as your debugger because the features VS.NET has are more advanced than the other choices. Figure 1.5.24 shows the JIT debug dialog after an unhandled exception. Here, you see that the options are to use the debugger that's already running (this is the one being used to edit the AnApplication used in this chapter), to use the CLR debugger (a standalone debugger), or a new instance of Visual Studio.NET. Choosing a debugger and clicking Yes will run the selected debugger, which will break at the point the error was trapped. If the program that caused the exception was built with a debug configuration, you should be able to see the code and step through it to find the error. If the offending application was built with a release configuration, JIT might not be very useful because you will probably be presented with X86 assembly code to debug. |
| I l @ ve RuBoard |
EAN: 2147483647
Pages: 204


