7.3 The Big Board
|
| < Day Day Up > |
|
7.3 The Big Board
The Big Board provides a quick summary of the state of all active monitoring policies with policy status being determined by thresholds defined by the user or generated based on the automatic baselining capabilities incorporated into the product. Please refer to 8.3, "Deployment, configuration, and ARM data collection" on page 239 for a description of the automatic baselining and thresholding capabilities of TMTP Version 5.2. Figure 7-1 on page 214 shows an example of the Big Board with transactions failing, violating thresholds, and executing normally.
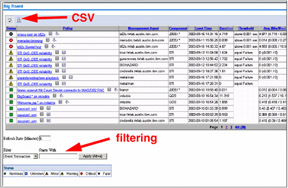
Figure 7-1: The Big Board
Event data updates the values for duration, time, and transactions as thresholds are breached. Those values are shown as columns. Uploaded aggregate data are used to update the Average (Min/Max) column so that even if there is no event activity, the row is changing. Clicking the monitoring policy name displays a summary table describing the policy's details, while clicking the Event icon displays a table with all the events for that policy.
| Icon | Description |
|---|---|
| | Display transaction events |
| | Display STI graph |
| | Display Topology View |
| | Export to CSV file |
| | Refresh view |
The Big Board provides two entry points into further reporting. The first is by clicking on the Display STI graph icon, where you are taken to the STI Bar chart view. The second is accessed by clicking on the Display Topology View icon, which brings you to the Topology View.
A refresh rate may be set, and stored in the user's settings, to update the Big Board at a certain interval. Users also have the option of clicking on the Refresh View icon to manually refresh the view.
The Big Board's columns may be filtered by entering criteria into the drop-down box at the bottom of the dialog and choosing a column to filter. The filtering is done by finding all the columns that start with the letters entered in the text field.
Data may be exported from the Big Board by clicking on the Export to CSV icon.
|
| < Day Day Up > |
|
EAN: 2147483647
Pages: 105
- Chapter I e-Search: A Conceptual Framework of Online Consumer Behavior
- Chapter II Information Search on the Internet: A Causal Model
- Chapter VIII Personalization Systems and Their Deployment as Web Site Interface Design Decisions
- Chapter XII Web Design and E-Commerce
- Chapter XVI Turning Web Surfers into Loyal Customers: Cognitive Lock-In Through Interface Design and Web Site Usability