3.1 Architecture overview
|
| < Day Day Up > |
|
3.1 Architecture overview
As discussed in Chapter 2, "IBM Tivoli Monitoring for Transaction Performance in brief" on page 37, IBM Tivoli Monitoring for Transaction Performance (hereafter referred to as TMTP) is an application designed to ease the capture of Transaction Performance information in a distributed environment. TMTP was first released in the mid 90s as two products: Tivoli Web Services Manager and Tivoli Application Performance Monitoring. These two products were designed to perform similar functions and were combined in 2001 into a single product, IBM Tivoli Monitoring for Transaction Performance. This heritage is still reflected today by the existence of two components of TMTP, the Enterprise Transaction Performance (ETP) and Web Transaction Performance (WTP) components. This release of TMTP blurs the distinction between the components and sets the stage for future releases where there will no longer be a distinction between ETP and WTP.
3.1.1 Web Transaction Performance
The IBM Tivoli Monitoring for Transaction Performance: Web Transaction Performance component is the area of the TMTP product where most changes have been introduced with Version 5.2. The basic architecture is shown in Figure 3-1 and elaborated on in further sections.
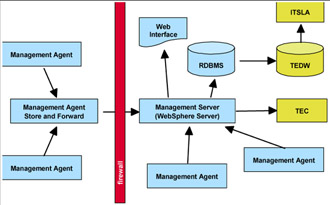
Figure 3-1: TMTP Version 5.2 architecture
This version of the product introduces a comprehensive transaction decomposition environment that allows users to visualize the path of problem transactions, isolate problems to their source, launch the IBM Tivoli Monitoring Web Health Console to repair the problem, and restore good response time.
WTP provides the following broad areas of functionality:
-
Transaction definition
The definition of a transaction is governed by the point at which it first comes in contact with the instrumentation available within this product. This can be considered the Edge definition, where each transaction, upon encountering the edge of the instrumentation available, will be defined through policies that define each transactions uniqueness specific to the Edge it encountered.
-
Distributed transaction monitoring
Once a transaction has been defined at its edge, there is a need for customers to define the policy that will be used in monitoring this transaction. This policy should control the monitoring of the transaction across all of the systems where it executes. To that end, monitoring policies are generic in nature and can be associated with any group of transactions.
-
Cross system correlation
One of the largest challenges in providing distributed Transaction Performance monitoring is the collection of subtransaction data across a range of systems for a specified transaction. To that end, TMTP uses an ARM correlator in order to correlate parent and child transactions.
All of the Web Transaction Performance components of ITM for TP share a common infrastructure based on the IBM WebSphere Application Server Version 5.0.1.
The first major component of Web Transaction Performance is the central Management Server and its database. The Management Server governs all activities in the Web Transaction Performance environment and controls the repository in which all objects and data related to Web Transaction Performance activity and use are stored.
The other major component is the Management Agent. The Management Agent provides the underlying communications mechanism and can have additional functionality implemented on to it.
The following four broad functions may be implemented on a Management Agent:
-
Discovery: Enables automatic identification of incoming Web transactions that may need to be monitored.
-
Listening: Provides two components that can "listen" to real end user transactions being performed against the Web servers. These components (also called listeners) are the Quality of Service and J2EE monitoring components.
-
Playback: Provides two components that can robotically playback or execute transactions that have been recorded earlier in order to simulate actual user activity. These components are the Synthetic Transaction Investigator and Rational Robot/Generic Windows components.
-
Store and Forward: May be implemented on one or more agents in your environment in order to handle firewall situations.
More details on each of these features can be found in 3.2, "Physical infrastructure components" on page 61.
3.1.2 Enterprise Transaction Performance
The Enterprise Transaction Performance (ETP) components are used to measure transaction performance from systems that belong to the Tivoli Management Environment. Typically, this implies that the transactions that are monitored take place between systems that are part of the enterprise network, also known as the intranet.
ETP has changed little, with the exception of the inclusion of the Rational Robot, since the previous version of ITM for TP and is only discussed briefly in this redbook. Other Redbooks that cover this topic more completely are:
-
Introducing Tivoli Application Performance Management, SG24-5508
-
Tivoli Application Performance Management Version 2.0 and Beyond, SG24-6048
-
Unveil Your e-business Transaction Performance with IBM TMTP 5.1, SG24-6912
ETP provides four ways of measuring transaction performance:
-
ARMed application
-
Predefined Enterprise Probes
-
Client Capture (browser-based)
-
Record and Playback
However, the base technology used in probes, Client Capture, and Record and Playback is that of ARM; Enterprise Transaction Performance provides the means to capture and manage transaction performance data generated by ARM calls. It also provides a set of ARMed tools to facilitate data gathering and provide transaction performance data from applications that are not ARMed themselves.
Applications that are ARMed issue calls to the Application Response Measurement API to notify the ARM receiver (in this case implemented by Tivoli) about the specifics of the transactions within the application.
The probes are predefined ARMed programs provided by Tivoli that may be used to verify the availability of and the response time to load Web sites, mail servers, Lotus® Notes® Servers, and more. The specific object to be targeted by a probe is provided as run-time parameters to the probe itself.
Client Capture acts like a probe. When activated, it scans the input buffer of the browser of a monitored system (typically an end user's workstation) for specific patterns defined at the profile level and records the response time of all page loads, which matches the patterns specified.
The previous version of TMTP included two different implementations of transaction recording and playback: Mercury VuGen, which supports a standard browser interface, and the IBM Recording and Playback Workbench, which provides recording capabilities for 3270 and SAP transactions. This release of TMTP adds the Rational Robot as an enhanced mechanism for recording and playing back generic Windows transactions. The Rational Robot functionality applies to both the ETP and WTP components of TMTP, and is more completely integrated with the WTP component. Appendix B, "Using Rational Robot in the Tivoli Management Agent environment" on page 439 discusses ways of integrating the Rational Robot with the ETP component.
Figure 3-2 on page 60 gives an overview of the ETP architecture.
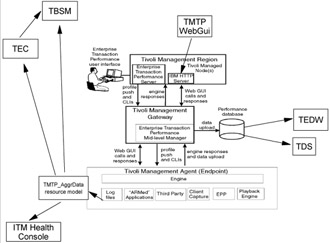
Figure 3-2: Enterprise Transaction Performance architecture
To initiate transaction performance monitoring, a MarProfile, which contains all the specifics of the transactions to be monitored, is defined in the scope of the Tivoli Management Framework and distributed to a Tivoli endpoint for execution. Based on the settings in the MarProfile, data is collected locally at the endpoint and may be aggregated to provide minimum, maximum, and average values over a preset period of time. Data related to specific runs of the transactions (instance data) and aggregated data may be forwarded to a central database, which may be used as the source for report generation through Tivoli Decision Support, and as data provider for other applications through Tivoli Enterprise Date Warehouse.
Online surveillance is facilitated through a Web-based console, on which current data at the endpoint and historical data from the database may be viewed.
In addition, two sets of monitors, a monitoring collection for Tivoli Distributed Monitoring 3.x and a resource model for IBM Tivoli Monitoring 5.1.1, are provided to enable generation of alerts to TEC and online surveillance through the IBM Tivoli Monitor Web Health Console. Note that both monitors are based on the aggregated data collected by the ARM receiver running at the endpoints and thus will not react immediately if, for example, a monitored Web site becomes unavailable. The minimum time for reaction is related to the aggregation period and the thresholds specified.
|
| < Day Day Up > |
|
EAN: 2147483647
Pages: 105