Lesson 2: Resolving Performance Problems
Lesson 2: Resolving Performance Problems
Estimated lesson time: 60 minutes
Even if your application was carefully designed and meticulously developed and deployed, it is still prone to performance problems. Performance problems can arise from a change in the operational environment, the addition of data, or improper use of indexes. You need to know what tools can be used to analyze application performance and be able to make recommendations on how to improve the application.
Analyzing Application Performance
There are several tools that can be used to troubleshoot poorly performing applications. In addition to the commonly used tools such as SQL Server Profiler and Windows System Monitor, SQL Server 2005 provides dynamic management views (DMVs) that expose statistical data through relational row sets. This section will review these tools and reveal how they can be used to diagnose commonly encountered problems.
Using SQL Server Profiler
SQL Server Profiler is a tool that allows you to capture detailed information about an event occurring in a SQL Server database. An event represents an action such as logging in to the server and executing a query or a stored procedure. Each event is associated with a class such as Audit Login and Audit Logout. These event classes are used to audit server activity, and they are two of the default events selected when you start a new trace.
A trace is like a recording in which you first define what events and columns should be monitored. From the point a trace is started, data will be collected and stored in either a table or a file. The data collected from a trace can be analyzed to reveal information about how the SQL Server database is performing. Typically, a trace will be associated with a goal, such as looking for long-running queries.
You can execute SQL Server Profiler in one of two ways. From SQL Server Management Studio, select SQL Server Profiler from the Tools menu. Alternatively, you can go to Start, All Programs, SQL Server 2005, Performance Tools, and SQL Server Profiler. Either way, you will encounter a blank window with a menu bar.
Templates provide a way to pre-load a trace with the events and columns associated with a particular goal. A default template is provided, along with several others. (See Table 8-3.) You can use the templates provided with SQL Server or create your own, saving them to a file with a .tdf file extension.
| Template Name | Goal | Event Category/Event Class |
|---|---|---|
| Standard (default) | Monitor general database activity | Security Audit/Audit Login Security Audit/Audit Logout Sessions/Existing Connection Stored Procedures/RPC:Completed TSQL/SQL:BatchStarting TSQL/SQL:BatchCompleted |
| SP_Counts | Capture stored procedure information over a period of time | Stored Procedures/SP:Starting |
| TSQL | Debug client-based applications | Security Audit/Audit Login Security Audit/Audit Logout Sessions/Existing Connection Stored Procedures/RPC:Completed TSQL/SQL:BatchStarting |
| TSQL_Duration | Identify long-running queries | Stored Procedures/RPC:Completed TSQL/SQL:BatchCompleted |
| TSQL_Grouped | Investigate queries from a particular user | Security Audit/Audit Login Security Audit/Audit Logout Sessions/Existing Connection Stored Procedures/RPC:Starting TSQL/SQL:BatchStarting |
| TSQL_Replay | Perform benchmark testing | Cursors/CursorClose Cursors/CursorExecute Cursors/CursorOpen Cursors/CursorPrepare Cursors/CursorUnprepare Security Audit/Audit Login Security Audit/Audit Logout Sessions/Existing Connection Stored Procedures/RPC Output Parameter Stored Procedures/RPC:Completed Stored Procedures/RPC:Starting TSQL/Exec Prepared SQL TSQL/Prepare SQL TSQL/SQL:BatchCompleted TSQL/SQL:BatchStarting |
| TSQL_SPs | Confirm that procedures are being recompiled | Security Audit/Audit Login Security Audit/Audit Logout Sessions/ExistingConnection Stored Procedures/RPC:Starting Stored Procedures/SP:Completed Stored Procedures/SP:Starting Stored Procedures/StmtStarting TSQL/SQL:BatchStarting |
| Tuning | Create a workload that is used by the Database Tuning Engine Advisor tool. | Stored Procedures/RPC:Completed Stored Procedures/SP:StmtCompleted TSQL/SQL:BatchCompleted |
To start a new trace, select New Trace from the File menu. You will first be prompted to connect to the SQL Server. You can connect to either the Database Engine or Analysis Services. Once connected, you will need to select properties for your trace, such as the trace name, template, and optional start and stop times. You will also specify whether the trace is saved to a file or a table. (See Figure 8-6.)
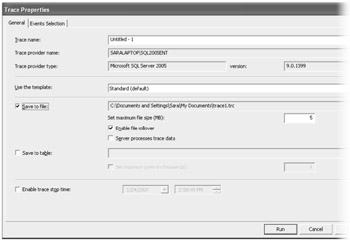
Figure 8-6: General trace properties for a new trace created with SQL Server Profiler
When you select a template on the General tab, certain events are automatically selected on the Events Selection tab. See Table 8-3 for a list of the templates included with SQL Server. If you prefer to select your own events and columns, you can choose Blank as the template. At this point, from the Events Selection tab, you will have to select which events and columns will be included in your trace. (See Figure 8-7.)
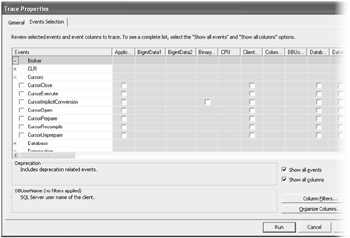
Figure 8-7: Events Selection tab for a new trace that is based on the blank template
To specify a new event using an existing template, you must first select the Show all events check box. This will display all events grouped by event category. Click the plus icon next to a category in the Events column to expand that node and see the events within the category. If a category contains selected events, the node will already be expanded.
When selecting a new event, you must also select the columns to be captured for that event. The columns are displayed as check boxes; you can select the Show All Columns check box to see them all displayed. Not all columns will be available for every event. For example, the column named Reads is used to track the number of logical reads performed by the server on behalf of the event. This column is available for events such as Audit Logout, but it is not available to the activation event for Service Broker.
The Events Selection tab allows you to specify column filters. This can be useful if you need to run a trace that monitors a single application. The server you are monitoring might be used by several applications. To ensure that the trace records events for one particular application, you could add a filter for the ApplicationName column where the name is like the name of your target application.
Once you have specified the trace properties, you will click Run to begin the recording. At this point, the trace will begin and you will see a split-screen window. (See Figure 8-8.) Unless you specified a start and stop time, the trace will run until you click the Stop Selected Trace button (the red stop icon on the toolbar) to stop the selected trace. While the trace is running, any events specified in the trace will appear in the top window, so you can watch the trace as it is running.
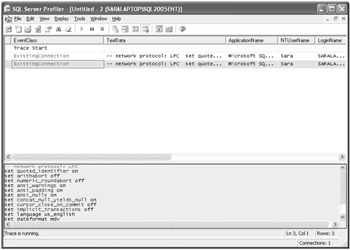
Figure 8-8: Events Selection tab for a new trace that is based on the blank template
Typically, you will run a trace at a time when you know the application is experiencing problems. Because SQL Server Profiler will consume server resources while running a trace, you do not want to allow the trace to run any longer than necessary. Once the trace is stopped, you can manually review the trace file or use it as input for the Database Engine Tuning Advisor tool.
| Best Practices | Use filters and run trace remotely Typically, you will be performing a trace against a production server. An active SQL Server will fill up a trace file very quickly. Use filters, if possible, to restrict the number of entries collected. Also, try to limit the number of events and columns selected. SQL Server Profiler will consume additional server resources while running a trace. If possible, use a separate server to monitor your production server remotely. |
Using System Monitor
Windows System Monitor, also known as PerfMon or Performance Monitor, is a graphical tool provided with Windows that can be used to monitor all aspects of a server's health. Like SQL Server Profiler, System Monitor provides results in real time, so you can monitor a server as it is experiencing problems. To start System Monitor, go to Start, All Programs, Administrative Tools, and Performance. Alternatively, you can type perfmon.msc from a command prompt. By default, System Monitor will display activity for the current machine. (See Figure 8-9.)
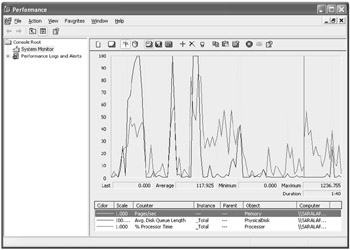
Figure 8-9: Default counters measured by local instance of System Monitor
System Monitor uses performance counters to represent the measurement of a specific object or system component. For example, the processor object has a counter that captures the percentage of processor time for a particular instance. Upon execution, System Monitor will begin monitoring three default counters (as shown in Table 8-4) for the current machine.
| Counter | Description | Object | Instance |
|---|---|---|---|
| Pages/sec | Represents the rate at which pages are read and written to the hard disk and can indicate system delays. | Memory | --- |
| Avg. Disk Queue Length | This is the average number of read and write requests that are queued. If this number consistently exceeds a value of 2, you could have an IO bottleneck. | Physical Disk | _Total |
| % Processor Time | Indicates the amount of processor activity by displaying the percentage of busy time. This counter should not exceed 80% per CPU. | Processor | _Total |
To add additional counters, click the Add button (the plus sign on the toolbar) above the graph to open the Add Counters dialog box and select a performance object. Each object represents a subsystem to be monitored and has one or more counters associated with it. Each counter might be associated with a particular instance, such as the ASP.NET worker process. In some cases, the counters are associated with all instances, which is represented as _Total. In cases where the object is not associated with an instance, the instance list box will be unavailable.
| Important | Permissions required Your Windows user account will need to be a member of the local Administrators group or Performance Log Users group for the server being monitored, or a member of the Domain Admins group for the network. |
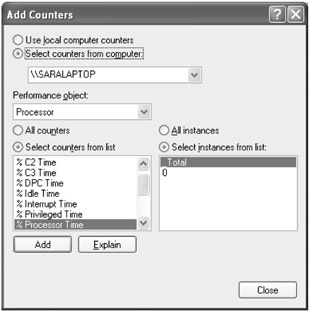
Figure 8-10: Add Counters dialog box used to add performance counters to a System Monitor graph
The next section, "Investigate Performance Problems," lists some additional performance counters that can be helpful for investigating specific problems with your server.
| Exam Tip | To understand how System Monitor works, you can download a free tool from MSDN called the Performance Monitor Wizard. This tool will help you select configuration settings and determine which counters are best. The utility is available at http://www.microsoft.com/downloads/details.aspx?FamilyID=&displaylang=en&Hash=7YTJ6NC. |
Using a Dynamic Management View
A dynamic management view (DMV) can be included in a SELECT query to return information about the health of your server and databases. New to SQL Server 2005, DMVs expose statistical information as a result set. The information included in each view can be critical to diagnosing problems with your SQL Server.
| Important | Permissions required You will need the SELECT permission for each object, along with the VIEW SERVER STATE or VIEW DATABASE STATE permission to use a DMV in a SELECT query. Which permission is required depends on whether the DMV is server-scoped or database-scoped. |
SQL Server 2005 provides dozens of views to represent all areas of SQL Server. Each DMV bears a prefix of dm_, and to reference the view in a SELECT query, you must use the two-part name. For example, the following query can be used to access the dm_exec_connections view:
SELECT * FROM sys.dm_exec_connections
The previous query will return information about all open connections. This will include a time stamp for the connection time, last read and write operations, and a count of the number of reads and writes. This DMV is just one of several built-in views that can be used to diagnose the health of your SQL Server.
Investigating Performance Issues
The previous section identified tools that you can use to analyze the performance of your SQL Server. Collecting the necessary information is the easy part. The hard part is identifying where a performance issue might lie. Ideally, you should be able to identify issues before end users suffer the consequences. This will allow you to proactively monitor and tune your SQL Server and ensure that all your database applications perform at their best.
Creating a Performance Baseline
A performance baseline is a chart or log that represents a period of time when the SQL Server was performing acceptably. The baseline can be created with Windows System Monitor or SQL Server Profiler. You can then refer to the result if the SQL Server begins to experience performance problems. By comparing the results from two collection periods, you can identify outliers that might indicate a problem.
Before creating a baseline, you will need to determine which performance counters or profiler events will be captured. Microsoft recommends that the performance counters listed in Table 8-5 are included in your performance baseline. You should also include the counters listed in Table 8-6. These counters will represent your System Monitor baseline; subsequent logs should contain the same counters.
| Object\Counter | Description |
|---|---|
| Memory\Pages/sec | Rate at which pages are read from or written to disk to resolve hard page faults |
| Network Interface\Bytes total/sec | Rate at which bytes are sent and received for the local connection |
| PhysicalDisk\Disk Transfers/sec | Rate at which read and write operations are performed for the physical disk selected in the instance list box |
| PhysicalDisk\Avg. Disk Queue Length | Average number of read and write requests that were queued for the sample interval |
| SQL Instance:Memory Manager\Total Server Memory | Total amount of memory the server is consuming |
| SQL Instance:Access Methods\Full Scans/sec | Number of unrestricted full table or index scans |
| SQL Instance:Buffer Manager\Buffer Cache Hit Ratio | Percentage of pages that were found in the buffer pool without having to incur a read from the disk |
| SQL Instance:Databases\Log Growths | Total number of log growths for the database specified in the Instances list box |
| SQL Instance:Databases\Percent Log Used | Percentage of space used by the log for the database specified in the Instances list box |
| SQL Instance:Databases\Transactions/sec | Number of transactions started for the database specified in the Instances list box |
| SQL Instance:General Statistics\User Connections | Number of users connected to SQL Server |
| SQL Instance:Latches\Average Latch Wait Time | Average wait time for waiting latch requests |
| SQL Instance:Locks\Average Wait Time | Average wait time for waiting lock requests |
| SQL Instance:Locks\Lock Waits/sec | Number of lock requests that were forced to wait for the lock to be granted |
| SQL Instance:Locks\Number of Deadlocks/sec | Number of lock requests that resulted in a deadlock |
| SQL Instance:Memory Manager\Memory Grants Pending | Number of processes waiting for a workspace memory to be granted |
| Object\Counter(s) | Used to Diagnose |
|---|---|
| SQL Instance:SQL Statistics\SQL Re-compilations SQL Instance:SQL Statistics\Batch Requests/sec | Indicates whether there are compiles and recompiles occurring. The ratio between these two numbers should be low. |
| SQL Instance:Cursor Manager by Type\Cursor Requests/sec | Indicates the ratio between hits and lookups and can reveal how many cursors are being utilized. If this number is high, you might be using cursors poorly and causing an unnecessary burden on system resources. |
| Memory\Available bytes | Indicates if there is enough physical memory available to the server. This value should be as high as possible, relative to the baseline. |
| Memory\Commit Limit Paging File\%Usage Paging File\%UsagePeak | Indicates whether there is enough virtual memory available to the server. The two paging counters should not be high relative the baseline, and the commit limit should be high because this represents the maximum amount of memory that can be committed without extending the page file space. |
| Physical Disk\Avg. Disk Sec/Read Physical Disk\Avg. Disk Sec/Write Physical Disk\%Disk Time | Indicates whether there is a possible I/O bottleneck on the server. The average disk counters should not exceed 50 ms, and the disk time counter should not exceed 50 percent. |
| SQL Instance:General Statistics\User Connections | Indicates the number of users connected to the instance. This can be useful in determining if you have connections that are not being closed. The amount should not be high relative to a baseline. |
For baselines created with Windows System Monitor, you will need to specify a sampling interval. By default, a performance counter is sampled every second. You can change this interval of time to the number of seconds you prefer.
In addition to the performance counters listed in Tables 8-5 and 8-6, you might need to use DMVs to investigate outliers. Table 8-7 lists key DMVs that can be used to diagnose problems with your SQL Server.
| Dynamic Management View(s) | Used to Diagnose |
|---|---|
| sys.dm_db_file_space_usage sys.dm_db_session_space_usage | Returns space information about a database and can be used to monitor the space in the tempdb. Session Space Usage can then be used to get information about a particular session. |
| sys.dm_db_index_operational_stats sys.dm_db_index_usage_stats | Operational Stats returns index usage statistics and can be used to identify excessive blocking. Usage Stats returns statistics about all indexes in use and can be useful for monitoring index usage. |
| sys.dm_exec_cursors sys.dm_exec_connections | Returns detailed information about all open cursors for a specific session. This can be used to identify poor cursor usage. When combined with the Connections view, you can track down a specific problem connection. |
| sys.dm_exec_query_optimizer sys.dm_exec_query_stats | The Optimizer Info view returns information about the query optimizer and can help determine if too much time is spent doing compiles. Query Stats returns aggregate data about cached query plans and can be used to identify inefficient query plans. This view can also help identify which request is generating the most I/O and potentially causing an I/O bottleneck. |
| sys.dm_os_memory_clerks | Returns information about all active SQL Server memory clerks. Memory clerks are used by components to allocate memory, so this can be used to identify a memory issue. |
| sys.dm_os_schedulers | Returns information about tasks for each scheduler and can be used to identify runaway tasks, which might indicate a CPU bottleneck. |
| sys.dm_os_waiting_tasks | Returns information about tasks waiting for resources and can be used to identify slow-running queries. |
Several scenarios cause the performance of SQL Server to diminish. In some cases, there might be multiple issues that contribute to a problem. Following are issues commonly encountered with SQL Server:
Inefficient Queries or Slow-Running Queries
These can be caused by missing indexes because the absence of an index forces the query optimizer to perform a table scan. Table scans are expensive in terms of resources, and you want to avoid them if at all possible.
Another possibility is that the table(s) is using an inefficient query plan. This might occur when there are changes to the statistical information, but it can also occur when query hints are utilized. Query hints override the query plan selected by the query optimizer, and generally, this is not a good idea. Query hints should only be used by experienced database developers in situations where there is a compelling reason to use one.
You might also check to see whether the table(s) contains too much data. The database might need to be partitioned. Typically, it might take millions or billions of records before significant delays are experienced.
A final possibility is that the database was designed poorly. If tables are not normalized and no relationships exist between related tables, you could experience delays in returning data.
Excessive Blocking
This can occur when the wrong isolation level is used for a transaction. Transactions are utilized when there is a need to update data and prevent others from modifying the data at the same time. There are several types of isolation levels allowed by SQL Server. Read uncommitted is the least restrictive; serializable is the most restrictive.
If a transaction is held open for longer than necessary, it can cause delays for an application with high activity. Transactions should be opened and closed as quickly as possible to avoid unnecessary delays.
I/O and CPU Bottlenecks
Resource bottlenecks can occur for various reasons, and when they occur suddenly, it is generally not caused by insufficient hardware. Both I/O and CPU bottlenecks can occur if you are using a poor execution plan or there are missing indexes. A problem can also occur if SQL Server was not configured with enough memory. You might also consider how the physical files are allocated. Log files and data files should rarely exist on the same physical disks, and multiple data files can reside on separate physical disks as well.
Limited Space for tempdb
Continuously monitoring the tempdb helps to prevent your SQL Server from running out of space and experiencing errors. There are several things that can cause SQL Server to run low on space for the tempdb. For example, applications might hold transactions open too long, stored procedures and user-defined functions might create and drop a large number of temp tables, and query plans might create too many temporary objects.
Memory Issues
Memory can refer to physical or virtual memory, whether internal or external. Although it might be necessary to add more memory to the SQL Server, issues might also be resolved by adjusting the demands for major memory consumers, adjusting the server configuration, and increasing the swap file size.
Orphaned Connections
A common mistake for new and even some experienced database developers is to leave connections open too long or not to close them at all. If a database connection is not specifically closed, it can remain open for some time before it times out and is released. Connections that are not specifically released are known as orphaned connections; they can cause an unnecessary consumption of resources.
For more information about analyzing and resolving SQL Server performance problems, refer to the TechNet article "Troubleshooting Performance Problems in SQL Server 2005" at http://www.microsoft.com/technet/prodtechnol/sql/2005/tsprfprb.mspx.
Lab: Analyzing Performance
In this lab, you will analyze the performance of a single Web page. You will create an ASP.NET project that retrieves data from the database using a DataSet. Using the Web Application Stress Tool (available from http://www.microsoft.com/downloads), you will simulate execution of the Web page while running a trace with SQL Server Profiler.
The completed code examples, in Visual Basic, C#, and Transact-SQL, are available in the \Labs\Chapter 08 folder on the companion CD.
| Important | Lab requirements You will need to have SQL Server 2005 and Visual Studio 2005 installed before you can complete this lab. Refer to the Introduction for setup instructions. |
Exercise 1: Use Profiler to Analyze Performance
In this exercise, you will create a new ASP.NET project that will be used to connect to the AdventureWorks database, retrieve product data for all products, populate a DataSet, and then use that data to populate a dataGridView control. The Microsoft Web Application Stress Tool will be used to simulate activity for the project. You will then run a trace using SQL Profiler and view the results.
-
Open Visual Studio 2005.
-
On the File menu, select New, Project.
-
In the New Project dialog box, expand the Other Project Types node and select Visual Studio Solutions. Type TK442Chapter8 for the name of your blank solution, and place it in a directory of your choosing. Click OK.
-
On the File menu, select Add, New Web Site. Select ASP.NET Web site as the template, and type http://localhost/TK442Chapter8CSharp or http://localhost/TK442Chapter8VB as the project name. Set the language by selecting Visual Basic, Visual C#, or Visual J# from the language drop-down list box. By default, Visual Studio will select the language specified when it was first configured.
-
From the Source pane, add the following code below the form tag:
<asp:Button runat="server" Text="Get Products" /> <asp:GridView runat="server"> </asp:GridView> <asp:Label runat="server"></asp:Label>
-
Right-click the Default.aspx file from Solution Explorer, and select View Code. Add the following code at the top of the code pane:
//C# using System.Data; using System.Data.SqlClient; 'VB Imports System.Data Imports System.Data.SqlClient
-
Add the following code beneath Inherits System.Web.UI.Page, modifying connection strings to match your environment:
//C# protected void btnGetProducts_Click(object sender, EventArgs e) { DataSet dsProducts = new DataSet("Products"); SqlDataAdapter adapter = new SqlDataAdapter(); //Initiate the connection to SQL Server String connString = @"server=.\SQL2005ENT;" + "uid=sa;pwd=gator;" + "Database=AdventureWorks"; SqlConnection conn = new SqlConnection(connString); //Define the query that will be executed SqlCommand cmd = new SqlCommand("SELECT * FROM Production.Product" + " WHERE SafetyStockLevel > 500", conn); try { //Populate the adapter with results of the query adapter.SelectCommand = cmd; adapter.Fill(dsProducts); //Set the datasource for the GridView control on the form GridView1.DataSource = dsProducts.Tables[0]; GridView1.DataBind(); } catch (Exception ex) { //write error to the label lblError.Text = ex.Message; } finally { if (adapter != null) { adapter.Dispose(); adapter = null; } if (cmd != null) { cmd.Dispose(); cmd = null; } if (conn != null) { if (conn.State == ConnectionState.Open) { conn.Close(); } conn = null; } } } 'VB Protected Sub btnGetProducts_Click(ByVal sender As Object, ByVal e As System.EventArgs) Handles btnGetProducts.Click Dim dsProducts As New DataSet("Products") Dim adapter As New SqlDataAdapter() 'Initiate the connection to SQL Server Dim connString As String = "server=.\SQL2005ENT;" & _ "uid=sa;pwd=gator;" & _ "Database=AdventureWorks" Dim conn As New SqlConnection(connString) 'Define the query that will be executed Dim cmd As New SqlCommand("SELECT * FROM Production.Product" & _ " WHERE SafetyStockLevel > 500", conn) Try 'Populate the adapter with results of the query adapter.SelectCommand = cmd adapter.Fill(dsProducts) 'Set the datasource for the dataViewGrid control on the form GridView1.DataSource = dsProducts.Tables(0) GridView1.DataBind() Catch ex As Exception lblError.Text = ex.Message Finally If Not (adapter Is Nothing) Then adapter.Dispose() adapter = Nothing End If If Not (cmd Is Nothing) Then cmd.Dispose() cmd = Nothing End If If Not (conn Is Nothing) Then If (conn.State = ConnectionState.Open) Then conn.Close() End If conn = Nothing End If End Try End Sub -
Save the project by selecting File, Save All.
-
Press Ctrl+F5 to build the project without debugging. Ensure that the project builds successfully. The default Web page should appear after the project compiles and executes. You should see a button labeled "Get Products." Click this button. You should see the data results displayed in the GridView control.
-
Open SQL Server Profiler by selecting Start, All Programs, Microsoft SQL Server 2005, Performance Tools, SQL Server Profiler.
-
Select File, then New Trace.
-
Enter the connection information for the server that contains the AdventureWorks database.
-
From the Trace Properties dialog box, enter a name for the Trace and select the Save to table check box. You will then be prompted to log in to the SQL Server 2005 database again.
-
From the Destination Table dialog box, select AdventureWorks as the database and enter the name TraceResults as the table. Click OK to continue. Do not close SQL Server Profiler or the Trace Properties dialog box.
-
Open the Microsoft Web Application Stress Tool by selecting Start, All Programs, then Microsoft Web Application Stress Tool. If you have not already installed this utility, refer to the setup instructions in the Introduction.
-
Click Record in the Create New Script dialog box.
-
Click Next and then Finish to begin the recording. A blank Microsoft Internet Explorer page should appear. Type the following in the URL address bar:
//C# http://localhost/TK442Chapter8CSharp/Default.aspx 'VB http://localhost/TK442Chapter8VB/Default.aspx
-
Click the Get Products button, and ensure that the products are displayed.
-
Return to the Web Application Stress Tool, and click Stop Recording. This will create a new recorded script that you can use to simulate user activity. Do not close the Web Application Stress Tool.
-
Return to the Trace Properties dialog box, and click Run to start the trace. Do not close or stop the SQL Server Profiler trace.
-
Return to the Web Application Stress Tool, and click Run from the Scripts menu. By default, the script will take one minute to complete. Wait until it finishes before continuing to the next step.
-
Return to SQL Server Profiler, and click Stop from the Replay menu to end the trace recording. SQL Server Profiler will now contain a result window that lists several records and columns recorded during the trace. Scroll through the results, and take note of the columns EventClass, TextDate, CPU, Reads, Writes, and Duration.
-
Open SQL Server Management Studio, and connect to the database that contains the AdventureWorks database.
-
Select the AdventureWorks database from the database drop-down list box.
-
Select New Query, and enter the following query:
SELECT * FROM dbo.TraceResults
-
The results stored in the TraceResults table are the same that were displayed in SQL Server Profiler. Storing the results in SQL Server allows you to query the data and potentially combine results with dynamic management functions.
EAN: N/A
Pages: 162