Using the Report Wizard
The Report Wizard that Access 2007 provides to assist you in constructing reports is similar to the Form Wizard you used earlier to create forms. To practice using the Report Wizard, we’ll build the Contact Events report again. Click the Navigation Pane menu, click Object Type under Navigate To Category, and then click Queries under Filter By Group. Select the qryRptContactEvents query in the Navigation Pane, and then click the Report Wizard button in the Reports group on the Create tab to open the Report Wizard.
Specifying Report Wizard Options
On the first page of the Report Wizard, shown in Figure 30–20, select the fields you want in your report. (If you have a table or query selected in the Navigation Pane and then click the Report Wizard button, Access automatically uses that object as the record source for the report.) You can select all available fields in the order in which they appear in the underlying query or table by clicking the double right arrow (») button. If you want to select only some of the fields or if you want to specify the order in which the fields appear in the report, select one field at a time in the Available Fields list and click the single right arrow (>) button to move the field to the Selected Fields list. If you make a mistake, you can select the field in the Selected Fields list and then click the single left arrow (<) button to move the field to the Available Fields list. Click the double left arrow («) button to remove all selected fields from the list on the right and start over.
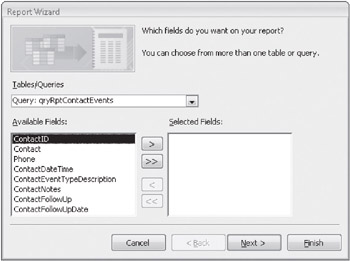
Figure 30–20: Select fields to include in the report on the first page of the Report Wizard.
To create the Contact Events report, you should select all the fields. Then, click the Next button to go to the next page.
| Inside Out-Selecting Fields from More Than One Table and/or Query | You can also select fields from one table or query and then change the table or query selection in the Tables/Queries list. The Report Wizard uses the relationships you defined in your database to build a new query that correctly links the tables or queries you specify. If the wizard can’t determine the links between the data you select, it warns you and won’t let you proceed unless you include data only from related tables. |
The wizard examines your data and tries to determine whether there are any natural groups in the data. Because this query includes information from the tblContacts table that has a one-to-many relationship to information from the tblContactEvents table, the wizard assumes that you might want to group the information by contacts (the ContactID, Contact, and Phone fields), as shown in Figure 30–21. If you don’t want any report groups or you want to set the grouping criteria yourself, select By tblContactEvents. In this case, the Report Wizard has guessed correctly, so click Next to go to the next step.
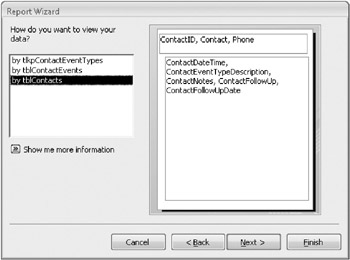
Figure 30–21: Make sure to verify the primary grouping criteria on the second page of the Report Wizard.
On the next page (shown in the background in Figure 30–22), the Report Wizard shows you the grouping already selected for ContactID and asks whether you want to add any grouping levels below that. (If you chose to set the criteria yourself-by choosing By tblContactEvents on the previous page-you will see a similar window with no first group selected.) You can select up to four grouping levels. The wizard doesn’t allow you to enter an expression as a grouping value-something you can do when you build a report from scratch. If you want to use an expression as a grouping value in a report that you create with the Report Wizard, you have to include that expression in the underlying query. For this report, you could also group within each contact by the ContactDateTime field, so select that field and click the single right arrow to temporarily add it as a grouping level.
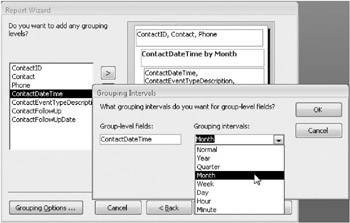
Figure 30–22: You can set grouping intervals on the grouping fields in the Report Wizard.
When you add grouping levels, the Report Wizard makes the Grouping Options button available for those levels. You can select the ContactDateTime By Month grouping level on the right side of this page and then click this button to see the Grouping Intervals dialog box, shown in Figure 30–22. For a text field, you can group by the entire field no or by one to five of the leading characters in the field. For a date/time field, you can group by individual values or by year, quarter, month, week, day, hour, or minute. For a numeric field, you can group by individual values or in increments of 10, 50, 100, 500, 1,000, and so on, up to 500,000. As you can see, the Report Wizard has automatically assumed grouping by month when you added the ContactDateTime field as a grouping level. You don’t need that grouping level in this sample, so cancel the Grouping Intervals dialog box, select ContactDateTime By Month on the right side of the page, and click the single left arrow to remove it. Then click Next.
On the next page, shown in Figure 30–23, the Report Wizard asks you to specify any additional sorting criteria for the rows in the Detail section. (Access will sort the report at this point by the grouping level fields you specified on the previous page.) You can select up to four fields from your table or query by which to sort the data. By default, the sort order is ascending. Click the button to the right of the field selection list box to switch the order to descending. You can’t enter expressions as you can in the Group, Sort, And Total pane. In this report, click the arrow to the right of the first box and select the ContactDateTime field. Click the button to the right once to switch it to Descending, as shown in the figure.
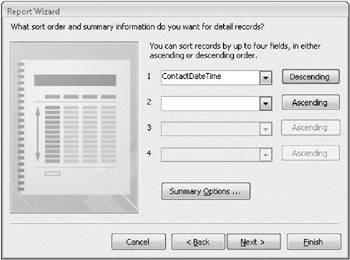
Figure 30–23: Select ContactDateTime on the fourth page of the Report Wizard to sort on that field.
Click the Summary Options button to open the dialog box shown in Figure 30–24. Here you can ask the Report Wizard to display summary values in the group footers for any numeric fields the wizard finds in the Detail section. In this case, the Report Wizard sees that the ContactFollowUp field is the only one in the Detail section that is a number (a Yes/No data type). As you’ll see later, the Report Wizard automatically generates a count of the rows, which explains why Count isn’t offered as an option.
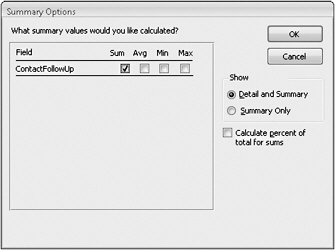
Figure 30–24: Click the Summary Options button on the fourth page of the Report Wizard to select additional summary options.
Select the Sum check box for this field. (You can add the minus sign after the wizard is done to get the correct count.) Note that you also have choices to calculate the average (Avg) of values over the group or to display the smallest (Min) or largest (Max) value. You can select multiple check boxes. You can also indicate that you don’t want to see any detail lines by selecting the Summary Only option. (Sometimes you’re interested in only the totals for the groups in a report, not all of the detail.) If you select the Calculate Percent Of Total For Sums check box, the Report Wizard will also display, for any field for which you have selected the Sum check box, an additional field that shows what percent of the grand total this sum represents. When you have the settings the way you want them, click OK to close the dialog box. Click Next in the Report Wizard to go on.
On the next page, shown in Figure 30–25, you can select a layout style and a page orientation for your report. When you select a layout option, the Report Wizard displays a preview on the left side of the page. In this case, the Outline layout option in Portrait orientation will come closest to the hand-built report you created earlier in this chapter. You should also select the check box for adjusting the field widths so that all the fields fit on one page.
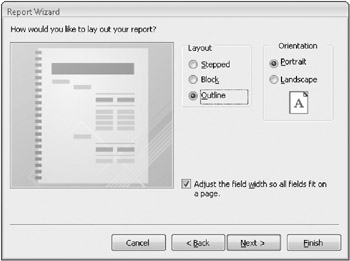
Figure 30–25: Choose a layout style and page orientation on this page of the Report Wizard.
Click Next to go to the next page of the Report Wizard. On this page you can select from 25 built-in report styles. If you defined your own custom report style using AutoFormat in Design view, you can also select your custom style. Some of the built-in styles are probably better suited for informal reports in a personal database. Other formats look more professional. Also, some styles include many color elements while others just a few. When you select a style option, the wizard displays a preview on the left side of the page. For this example, select the Access 2007 style. Click Next to go to the final page of the Report Wizard, shown in Figure 30–26.
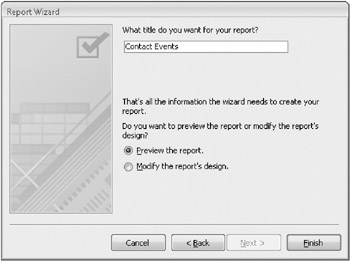
Figure 30–26: You can specify a report title on the last page of the Report Wizard.
Here, you can type a report title. Note that the wizard uses this title to create the report caption that is displayed in the title bar of the window when you open the report in Print Preview, the label that serves as the report header, and the report name. It’s probably best to enter a title that’s appropriate for the caption and label and not worry about the title being a suitable report name. If you’re using a naming convention (such as prefixing all reports with rpt as we’ve done in the sample databases), it’s easy to switch to the Navigation Pane after the wizard is done to rename your report. In this case, enter Contact Events as the title.
Viewing the Result
Select the Preview The Report option on the final page of the Report Wizard, and then click the Finish button to create the report and display the result in Print Preview, as shown in Figure 30–27. One of the first things you will notice is that Access has created alternating background colors for the detail lines to make it easier to see the data that goes with each record. This feature can be very useful if reports have a lot of information in the detail records and if the lines are packed close together.
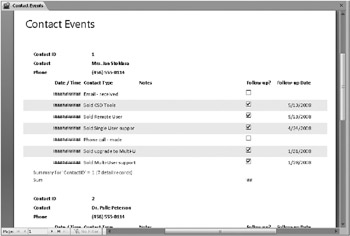
Figure 30–27: This is the first page of the Contact Events report created using the Report Wizard.
It’s easy to use Design view or Layout view to modify minor items (such as adjusting the width and alignment of the ContactDateTime and ContactEventDescription fields and resizing the labels) to obtain a result nearly identical to the report you constructed earlier. You can see in Figure 30–27 that the ContactDateTime field displays # symbols for all the records. Access displays # symbols for date/time and numeric fields when it cannot display all the data in the control, but only when you select the Check For Truncated Number Fields check box under Application Options in the Current Database category of the Access Options dialog box. You also need to fix the expression in the text box that calculates the Sum of the ContactFollowUp field and change the format to display the number. (The Report Wizard set the format to Yes/No.) You should also change the Sum label associated with this calculation. We’ll show you how to fix all these problems in the next section. You can find the Report Wizard’s report at this point saved as rptXmplContactEvents2 in the sample database. As you might imagine, the Report Wizard can help you to get a head start on more complex report designs.
Modifying a Wizard-Created Report in Layout View
In the previous section you used the Report Wizard to create a report for contact events. Now you need to clean up this report so that it more closely resembles the Contact Events report you built from scratch earlier in this chapter. Using Layout view makes this process quick and easy. Right-click the Contact Events report in the Navigation Pane (or rptXmplContactEvents2) and click Layout View on the shortcut menu to open this report in Layout view, as shown in Figure 30–28.
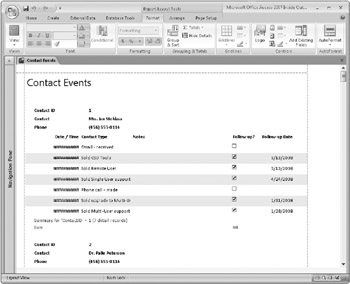
Figure 30–28: Open the Contact Events report in Layout view to begin making changes.
Access 2007 shows the Report Layout Tools collection of three contextual tabs-Format, Arrange, and Page Setup-on the Ribbon. The report design grid in Layout view looks less like a grid than a sheet of paper. You’ll also notice that there are no page breaks in Layout view, and by default Access displays dashed lines along the edges of the report to denote the print margins.
You first need to make the ContactDateTime field wider to accommodate the data. In Layout view you can see live data, so making column adjustments like this is easy.
Click the ContactDateTime label in the first group (the label Date/Time), move your mouse pointer to the left edge of the highlighted control until it becomes a double-sided arrow, and then drag the control to the left until you can see the dates and times in the records, as shown in Figure 30–29. After you adjust the field width for the Date/Time label, click the Center button in the Font group on the Format tab to center the text in the label.
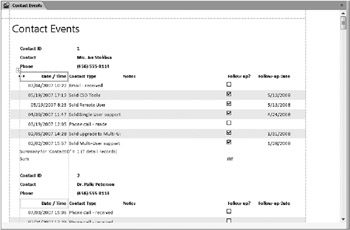
Figure 30–29: Drag the ContactDateTime label control to the left to resize the entire column.
The ContactEventTypeDescription field also needs to be wider because some of the data is being truncated. Click the ContactEventTypeDescription label in the first group (the label Contact Type), move your mouse pointer to the right edge of the highlighted control until it becomes a double-sided arrow, and then drag the control to the right until you can see all the various contact event descriptions in the records, as shown in Figure 30–30. After you make this adjustment, you can scroll down the records to see whether the increased width accommodates the data in each record. As you make the ContactEventTypeDescription field wider, Access pushes the remaining fields further to the right. If you look closely at Figure 30–30, you can see that the ContactFollowUpDate field now extends past the print margin. Without even having to switch to Print Preview, you know you have to make further field size adjustments in order to keep the data from spanning across pages.
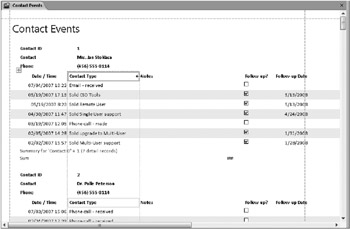
Figure 30–30: When you make the ContactEventTypeDescription field wider, Access moves the other columns to the right.
The Notes field seems to be too wide, so let’s shorten this field to make room for the other fields. Click the Notes field label and reduce the width by dragging the right edge to the left until the ContactFollowUpDate field is within the print margin.
The label for the number of events requiring follow-up displays only the word Sum at the moment. This label is certainly not very descriptive, so let’s change it to something more meaningful. Double-click on the Sum label and type Number of events that require a follow-up: directly over the word Sum. After you press Enter, Access automatically resizes the control to accommodate the new text, as shown in Figure 30–31.
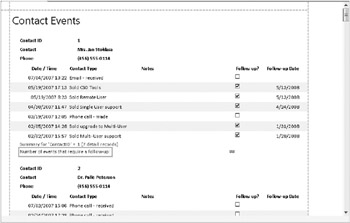
Figure 30–31: Access resizes the control for you in Layout view when you enter a new caption for a label.
You now need to move this label closer to the control that actually lists the sum of the follow-up check boxes. Because there are no controls between the label and the Sum control you have two choices-you can drag the right edge of the label to the Sum control (and right align the text) or you can move the label closer to the Sum control. Let’s move this control closer instead of resizing it. Select the label control so that the edges are highlighted with a different color and then drag it closer to the Sum control, as shown in Figure 30–32. As you drag the control, Access displays an outline of the label’s size dimensions so that you can easily judge how it will fit in its new position. Release the mouse to drop the label into place next to the Sum control.
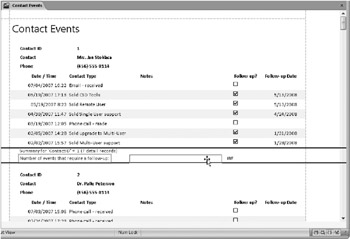
Figure 30–32: You can easily drag and drop controls into new positions using Layout view.
The Sum control in the Follow Up? column needs to be wider because it is displaying # symbols as was the ContactDateTime field. Resize this control by dragging its right edge. You can now see that Access displays only Yes or No values instead of an actual count. The Report Wizard in this case did not create an expression to correctly calculate the number of follow-ups. Select this control and click the Property Sheet command in the Tools group on the Arrange tab (or press the F4 key) to open the property sheet. Click the All tab on the property sheet and change the Control Source to
= -Sum([ContactFollowUp])
Move down to the Format property and select Standard from the list of formats to display a number in this control instead of Yes or No. Finally, move down to the Decimal Places property and choose 0 from the list of options to display only whole numbers in the field, as shown in Figure 30–33. Access now displays an integer value representing the number of follow-ups needed. Close the property sheet to see the entire report again.
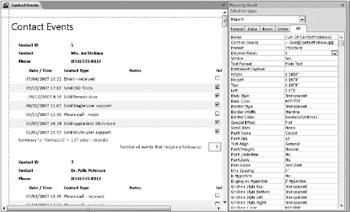
Figure 30–33: Change the properties of the Sum Of ContactFollowUp control in order to display an integer instead of a Yes or No value.
The Report Wizard created alternating background colors for the detail records in this report. The color is light, so let’s change that color to provide more contrast. Click the far left edge of the report next to one of the detail records, and Access highlights all the detail records, as shown in Figure 30–34.
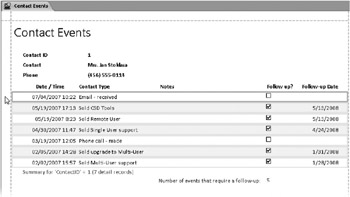
Figure 30–34: Click the left side of the report to highlight all the detail records.
Now click the arrow to the right of the Alternate Fill/Back Color button in the Font group on the Format tab to display a color palette. Select Medium Gray 1 to provide more contrast on the report, as shown in Figure 30–35.
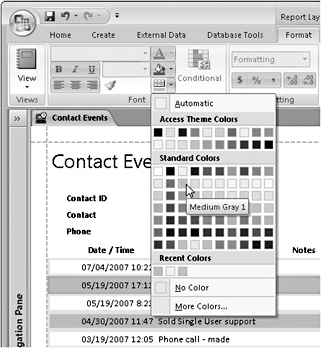
Figure 30–35: You can select an alternating background color to provide more contrast to your detail records.
Click the Save button on the Quick Access Toolbar to save the changes you made to this report. Switch to Print Preview to see how your completed report looks on paper, as shown in Figure 30–36. This report now looks very close to the Contact Events report you created from scratch earlier in the chapter. You can find this report saved as rptXmplContactEvents3 in the sample database. By using the Report Wizard to do all the heavy lifting and Layout view to make some quick changes, you can create a professional-looking report in a very short time.
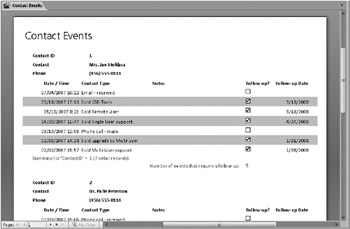
Figure 30–36: Your completed report now includes all the changes you made in Layout view.
EAN: 2147483647
Pages: 299