Chapter 30: Constructing a Report
Constructing a report is very similar to building a form. In this chapter, you’ll apply many of the techniques that you used in working with forms, and you’ll learn about some of the unique features of reports. After a quick tour of the report design facilities, you’ll build a simple report for the Conrad Systems Contacts database, and then you’ll use the Report Wizard to create the same report. You’ll see how to use the new Layout view to modify existing reports and create new ones. Finally, you’ll see how to use the quick create Report command to create a report with one mouse click.
| Note | |
Starting from Scratch-A Simple Report
In a contact tracking application, the user is going to want to take a look at recent events and perhaps work through a list of events that require follow-ups. Although the user could search for events in a form, the application should also provide a report that lists events by contact and shows the phone numbers the user needs. This report can be filtered by the application to print out only recent and upcoming events.
Most reports gather information from several tables, so you’ll usually design a query that brings together data from related tables as the basis for the report. In this section, you’ll build a relatively simple report to list contact events as you tour the report design facilities. The report you’ll build uses the tblContacts, tblContactEvents, and tlkpContactEventTypes tables in the ![]() ContactsDataCopy.accdb sample database. The report groups contact event data by contact, prints a single line for each contact event, and calculates the number of contact events and the number of follow-ups for each contact.
ContactsDataCopy.accdb sample database. The report groups contact event data by contact, prints a single line for each contact event, and calculates the number of contact events and the number of follow-ups for each contact.
Building the Report Query
To construct the underlying query for the report, you need to start with the tblContactEvents table. Click the Query Design button in the Other group on the Create tab. In the Show Table dialog box, select the tblContactEvents table, click the Add button to add it to the query design grid, and then add the tblContacts and the tlkpContactEventTypes tables as well. Click the Close button in the Show Table dialog box to dismiss it. You should see join lines between tblContacts and tblContactEvents on ContactID, and between tlkpContactEventTypes and tblContactEvents on ContactEventTypeID.
From the tblContacts table, add ContactID to the query design grid. The report needs to show the contact name, but it would be better to show the information concatenated in one field rather than separate title, first name, middle name, last name, and suffix fields. In the next column, enter this expression on the Field line:
Contact: ([tblContacts].[Title]+" ") & [tblContacts].[FirstName] &" " & ([tblContacts].[MiddleInit]+". ") & [tblContacts].[LastName] & (", "+[tblContacts].[Suffix]) Notice that the expression uses the plus sign concatenation operator to eliminate extra blanks when one of the fields contains a Null value-a technique you learned about in Chapter 28, “Creating and Working with Simple Queries.”
The query also needs to include the contact’s phone number, but the tblContacts table includes both a work and a home phone number. You can create an expression to examine the DefaultAddress field to decide which one to display. Microsoft Office Access 2007 provides a handy function, Choose, which accepts an integer value in its first argument and then uses that value to choose one of the other arguments. For example, if the first argument is 1, the function returns the second argument; if the first argument is 2, the function returns the third argument, and so on. The DefaultAddress field contains a 1 to indicate work address and a 2 to indicate home address. In the third field cell on the query design grid, enter the following:
Phone: Choose([tblContacts].[DefaultAddress], [tblContacts].[WorkPhone], [tblContacts].[HomePhone])
To complete your query, include the ContactDateTime field from the tblContactEvents table and the ContactEventTypeDescription field from the tlkpContactEventTypes table. (ContactEventTypeID in tblContactEvents is a meaningless number.) Then include the ContactNotes, ContactFollowUp, and ContactFollowUpDate fields from the tblContactEvents table. Figure 30–1 shows the query you need for this first report. Click the Save button on the Quick Access Toolbar to save your new query. (You can find this query saved as qryRptContactEvents in the sample database.)
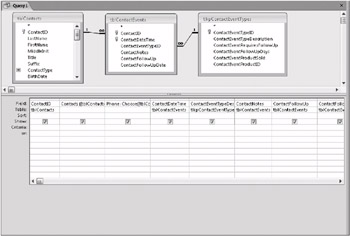
Figure 30–1: This query selects contact and contact event data for your report
Note that although you’re designing a report that will summarize the data, you are not building a totals query. If you used a totals query as the record source for the report, you would see only the summary in the report. One of the beauties of reports is that you can see the detail information and also ask the report to produce summaries. Also, you don’t need to specify any sorting criteria here-you’ll do that later in the report’s Group, Sort, And Total pane.
Designing the Report
Now you’re ready to start designing the report. Click the Report Design button in the Reports group on the Create tab to tell Office Access 2007 you want to begin creating a report in Design view, as shown in Figure 30–2.
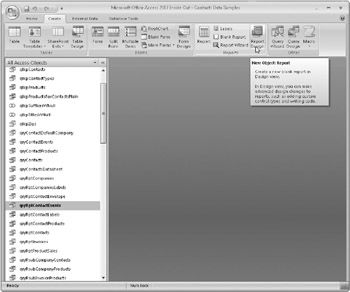
Figure 30–2: Click the Report Design button to start creating your report
The field list, the property sheet, and the Font and Controls groups on the Design contextual tab under Report Design Tools are similar to the features you used in building forms. See Chapter 29, “Building a Form,” for detailed descriptions of their uses.
Access 2007 opens a new Report window in Design view, as shown in Figure 30–3. You can see the Report Design Tools collection of Ribbon tabs at the top of the Access window. The Report window is in the middle of the screen, and the property sheet is open to assist you in building your report. (If necessary, you can click the Property Sheet button in the Tools group on the Design tab to open this window.) To begin constructing no your report you need to tell Access to use the qryRptContactEvents query as its record source. In the property sheet, select qryRptContactEvents (or the name of the query you just created) in the Record Source property, as shown in Figure 30–3.
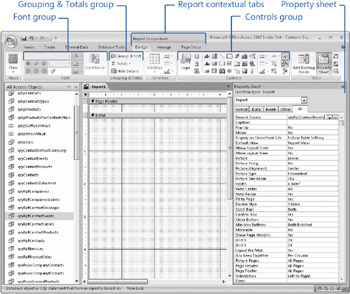
Figure 30–3: When you open a new Report window in Design view, Access displays all the tools you need to create the report.
The blank report has Page Header and Page Footer sections and a Detail section between them, which is 5.25 inches (13.333 cm) high and 6.1694 inches (15.668 cm) wide. The rulers along the top and left edges of the Report window help you plan space on the printed page. If you want standard 1-inch side margins, the body of the report can be up to 6.5 inches wide on an 8.5-by-11-inch page. The available vertical space depends on how you design your headers and footers and how you define the top and bottom margins. As with forms, you can drag the edge of any report section to make the section larger or smaller. Note that the width of all sections is the same, so if you change the width of one section, Access 2007 changes the width of all other sections to match.
Within each section you see a grid that has 24 dots per inch horizontally and 24 dots per inch vertically, with a solid gray line displayed at 1-inch intervals. If you’re working in centimeters, Access 2007 divides the grid into 5 dots per centimeter both vertically and horizontally. You can change these settings using the Grid X and Grid Y properties in the report’s property sheet. (If the dots are not visible in your Report window, click the Grid command in the Show/Hide group on the Arrange contextual tab; if the Grid command is already selected and you still can’t see the dots, try resetting the Grid X and Grid Y properties to lower numbers in the property sheet.)
The page header and page footer will print in your report at the top and bottom of each page. You can click the Page Header/Footer button in the Show/Hide group on the Arrange tab to add or remove the page header and page footer. You can also add a report header that prints once at the beginning of the report and a report footer that prints once at the end of the report. To add these sections to a report, click the Report Header/ Footer button in the same Show/Hide group. You’ll learn how to add group headers and group footers in the next section.
Grouping Sorting, and Totaling Information
A key way in which reports differ from forms is that on reports you can group information for display using the Group, Sort, And Total pane. Click the Group & Sort button in the Grouping & Totals group on the Design tab (shown in Figure 30–3) to open the no Group, Sort, And Total pane beneath the report design grid, as shown in Figure 30–4. (We collapsed the Navigation Pane in Figure 30–4.) In this pane you can define up to 10 fields or expressions that you will use to form groups in the report. The first item in the list determines the main group, and subsequent items define groups within groups.
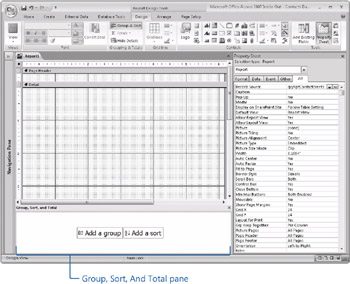
Figure 30–4: You can create groups and specify their sort order in the Group, Sort, And Total pane.
Because we have not yet defined any grouping or sorting in this report, the Group, Sort, And Total pane opens to a blank pane that allows you to click either Add A Group or Add A Sort.
In the simple report you’re creating for contact events, you need to group data by contact ID so that you can total the number of contact events as well as contact events that require follow-up for each contact. Click the Add A Group button in the Group, Sort, And Total pane. Access 2007 creates a new grouping specification and opens a list that contains all fields in the report’s record source next to the Group On option, as shown in Figure 30–5. (We collapsed the Navigation Pane and closed the property sheet in Figure 30–5 so that you can see more of the Group, Sort, And Total pane.)
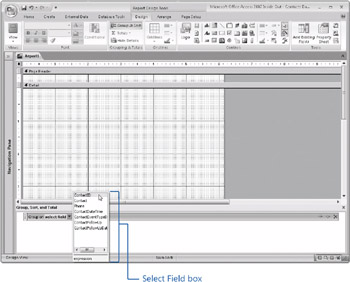
Figure 30–5: After you click Add A Group in the Group, Sort, And Total Pane, Access creates a new grouping specification and opens a field list to let you select the field that defines the group.
If you click away from the field list before selecting a field to define the group, Access 2007 closes the field list. Click the arrow on the Select Field box (or press Alt+Down Arrow while the focus is on the Select Field box) to open the list of fields from the underlying query or table. Select the ContactID field to place it in the Select Field box. You can also use the Select Field box to enter an expression based on any field in the underlying table or query. Open the field list again and click the Expression option below the list of fields, and Access opens the Expression Builder to help you create the expression. You let Access know you’re entering an expression by first typing an equal sign (=) followed by your expression. We discussed the Expression Builder in Chapter 28.
| Note | When you define a grouping specification in a report, the report engine actually builds a totals query behind the scenes to perform the grouping. You cannot use Group By in a totals query on memo, OLE object, hyperlink, or attachment fields. For this reason, you cannot use Memo, OLE Object, Hyperlink, or Attachment data types in the Group, Sort, And Total pane. |
After you select ContactID in the Select Field box, Access 2007 adds a new ContactID group header to the report grid beneath the Page Header group level, as shown in Figure 30–6. By default, Access sets the height of this new group level to 1\4 inch. Access also displays the Add A Group and Add A Sort buttons beneath the first grouping specification so you can create additional grouping or sorting levels. To the right of Group On ContactID in the Group, Sort, And Total pane, Access now adds two new options-From Smallest To Largest and More.
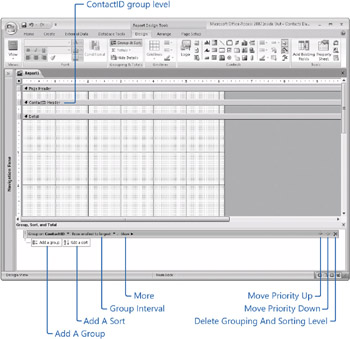
Figure 30–6: After you add a group in the Group, Sort And Total pane, Access creates a new group level on the grid.
By default, Access 2007 sorts each field or expression in ascending order. You can change the sort order by selecting From Largest To Smallest from the list that appears when you click the arrow to the right of the second option (From Smallest To Largest in this example). In this case, you want to include the ContactID field so that you can form a group for each contact. Leave the sort order on From Smallest To Largest so that the report will sort the rows in ascending numerical order by the ContactID field. If you wanted to see the contacts in alphabetical order by last name, you would need to include the LastName field in your query (even if you didn’t display it on the report), and group and sort on the LastName field. You could use the Contact expression that you included in the query, but then the report would sort the rows by title and first name.
| Note | Access 2007 changes the choices in the second option in the grouping specification depending on the data type of the field or expression you specified in Group On. When the data type is Text, you’ll see With A On Top and With Z On Top options. When the data type is Date/Time, you’ll see From Oldest To Newest and From Newest To Oldest. If the data type is Yes/No, you’ll see From Selected To Cleared and From Cleared To Selected. As you saw in our example, Access uses From Smallest To Largest and From Largest To Smallest for fields with a Numeric data type. |
Click the More option in the ContactID grouping specification to see all the grouping and sorting options, as shown in Figure 30–7. Access now displays a total of eight grouping and sorting options. If you look at Figure 30–7, you can see that Access creates a sentence structure to help you understand how this grouping level will take shape. If you want to collapse the list of options, click Less at the end of the list.
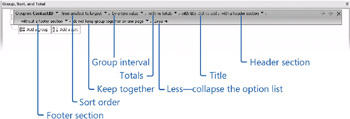
Figure 30–7: Click More to expand the list of grouping and sorting options.
The third option in the grouping specification (By Entire Value in our example) is called the group interval, which tells Access how to group the records. Click the arrow to the right of this option for a grouping based on the ContactID field, as shown in Figure 30–8. For AutoNumber, Number, and Currency data types, Access displays the following grouping options-By Entire Value, By 5s, By 10s, By 100s, By 1000s, and Custom, which lets you set your own interval. For Text data types, you can set the group interval to By Entire Value, By First Character, By First Two Characters, or Custom, which lets you set your own interval. For Date/Time data types, you can set the group interval to By Entire Value, By Day, By Week, By Month, By Quarter, By Year, or Custom, which lets you set your own interval. Leave the group interval set to By Entire Value for the ContactID group level.

Figure 30–8: The group interval displays different options based on the field’s data type.
You use the fourth option in the grouping specification (which currently displays With No Totals in our example) to configure Access to list totals for a single field or for multiple fields. Click the arrow to the right of this option for a grouping based on the ContactID field, as shown in Figure 30–9. Select the field on which you want Access to calculate and display totals from the Total On list. In the Type box you can choose from several types of calculations based on the data type of the field you chose in the Total On box. Beneath the Type box are four check boxes for additional totaling options. Select the Show Grand Total check box to add a grand total for this field in the report’s footer section. Select the Show Group Totals As % Of Grand Total check box if you want Access to calculate the percentage of the grand total for each group and place that percentage in the group header or footer. Select the Show In Group Header check box to place the total and optional percentage in the group’s header section and the Show In Group Footer check box to place the total and optional percentage in the group’s footer section. Leave the option for the Totals list set at With No Totals for the ContactID group level.

Figure 30–9: You can ask Access to calculate and display totals in the Totals list.
You use the fifth option in the grouping specification to define a title. You can choose to create a title that appears in a label control in the header section of the group. To create a title, click the blue Click To Add text. Access opens the Zoom dialog box, as shown in Figure 30–10, where you can enter a title. You can click Font to define the font, font style, size, and color of the title letters. After you enter a title, click OK, and Access creates a new label control in the group header section on the report grid. For the grouping based on the ContactID field, click Cancel to not enter a title at this time.
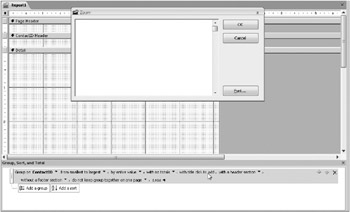
Figure 30–10: Access displays the Zoom dialog box when you want to add a title to a group header.
You use the sixth option in the grouping specification to display a header section for the specific group. Click the arrow to the right of this option and you can select either With A Header Section (the default selection) or Without A Header Section, as shown in Figure 30–11. When you select the option to include a header, Access creates the header section for the group for you. Conversely, Access removes the group header, and all controls in it, if you select the second option. If you have defined controls in the header section when you choose Without A Header, Access displays a confirmation dialog box explaining that you’re deleting both the header and all its controls, and asks you to confirm the deletion. For the ContactID field in our example, leave the option set to the default-With A Header Section.

Figure 30–11: You can choose to have Access create a group header for you.
Similar to the header section option, you can use the seventh option to display a footer section for the grouping specification. Click the arrow to the right of this option and select either With A Footer Section or Without A Footer Section (the default selection), as shown in Figure 30–12. When you select the option to include a footer, Access creates the footer section for you. Conversely, Access removes the group footer, and all controls in it, if you select the second option. If you have defined controls in the footer section when you choose Without A Footer, Access displays a confirmation dialog box explaining that you’re deleting both the footer and all its controls, and asks you to confirm the deletion. For the ContactID field you will need a place to put two calculated total fields (the count of contact events and the count of follow-ups). Click the arrow to the right of this option and select With A Footer Section.

Figure 30–12: Select the With A Footer Section option to include a footer section for the ContactID group on the report.
You use the last option in the grouping specification, as shown in Figure 30–13, to control how Access will lay out the report when you print it. Click the arrow to the right of this option, and you have three choices-Do Not Keep Group Together On One Page (the default), Keep Whole Group Together On One Page, and Keep Header And First Record Together On One Page.
![]()
Figure 30–13: You can choose from among several options to control how the report will look when printed.
The Do Not Keep Group Together On One Page option allows a section to flow across page boundaries. The Keep Whole Group Together On One Page option attempts to keep all lines within a section together on a page. If an entire group won’t fit on the current page (and the current page isn’t blank), Access moves to the top of the next page before starting to print the group, but the group still might overflow the end of the new page.
If you select Keep Header And First Record Together On One Page, Access does not print the header for the group at the bottom of the page if it cannot also print at least one detail record. For the Contact ID field, leave the option set to the default-Do Not Keep Group Together On One Page.
It would also be nice to see the contact events in descending date order for each contact (most recent or newest events first). To add the ContactDateTime field below ContactID, click the Add A Sort button and Access creates a new sort specification. Select ContactDateTime in the Select Field box and change the sort order to From Newest To Oldest. Click More to display the rest of the options available to you for the sort specification. Leave the group interval set to By Entire Value, and leave the Totals option set to the default With No Totals. Do not add a title for this field and make sure to not include a group header or group footer. (If you add a header or footer, Access changes your specification from a sorting specification to a grouping specification.) Finally, keep the last option set to Do Not Keep Group Together On One Page. Your completed sorting specification for the ContactDateTime field should look like Figure 30–14.
![]()
Figure 30–14: Access will now sort the contact event records for your report in descending order.
You can change the priority of two or more grouping or sorting specifications by using the arrows on the right side of the Group, Sort, And Total pane. If you need to move a group up one level, select that group and then click the up arrow one time. Similarly, if you need to move a group down one level, select that group and then click the down arrow one time. Access repositions any group headers and footers for you during this process. To delete a group level, select it and then click Delete (the X) to the right of the up and down arrows. Close the Group, Sort, And Total pane now by clicking the Close button on its title bar or by clicking the Group & Sort button in the Grouping & Totals group on the Design tab.
| Inside Out-Understanding Who Controls the Sorting | You can specify sorting criteria in the query for a report, but after you set any criteria in the Group, Sort, And Total pane, the report overrides any sorting in the query. The best way to ensure that your report data sorts in the order you want is to always specify sorting criteria in the Group, Sort, And Total pane and not in the underlying query. |
Completing the Report
Now you’re ready to finish building a report based on the tblContactEvents table. Take the following steps to construct a report similar to the one shown in Figure 30–15. (You can find this report saved as rptXmplContactEvents1 in the sample database.)
-
Click the Title button in the Controls group on the Design tab to place a new label control in the Report Header section. By default, Access enters the name of the report, in this case Report1, in the label. Click inside this label and highlight or delete the existing characters, type Contact Events, and press Enter to change the label’s caption. With the label control still selected, use the commands in the Font group on the Ribbon to change the font to Arial and the font color to Black. Next, click the Bold and Underline buttons in the Font group, and then click the Size To Fit command in the Size group on the Arrange tab to size the control to accommodate the new font adjustments. Access placed this title in a new section it created-the Report Header. Any control placed in the Report Header section gets printed only on the first page of the report. We want to see this label on every page, so select the label control and drag it down and drop it into the Page Header section. Now remove the Report Header section by clicking the Report Header/ Footer button in the Show/Hide group on the Arrange tab.
-
Click the Add Existing Fields button in the Tools group on the Design tab to show the field list. If you see Fields Available In Related Tables and Fields Available In Other Tables, click Show Only Fields In The Current Record Source at the bottom of the field list to reduce the number of fields and tables you see. Drag the Contact field from the field list and drop it into the ContactID Header section. Use Arial 10-point bold for the label control and the text box control. Select the text box control and make it about 2 inches wide so that there’s room to display all the characters in the contact name. Also drag and drop the Phone field into the header, and set the resulting text box control and the label control to Arial 10-point bold. Size all these controls to fit and line them up near the top of the section.
-
You’ll need some column labels in the ContactID Header section. The easiest way to create them is to set up the text box control so that it has an attached label with no colon, set the defaults for the label control to the font you want, drag and drop the fields you need into the Detail section, and then cut the label controls from their respective text box controls and paste them into the header.
First, widen the design area of the report to about 6.5 inches and increase the height of the ContactID Header section to about 0.5 inch to give yourself some room to work. Next, to set the default properties for the text box and label controls, make sure the property sheet is open (click the Property Sheet button in the Tools group on the Design tab). Click the Text Box button in the Controls group on the Design tab. Select the All tab in the property sheet, scroll down, and check that the Auto Label property is set to Yes and that the Add Colon property is set to No. Also, set the Font Name property to Arial and the Font Size property to 8. Click the Label button in the Controls group, and set its font to Arial 8-point bold and underlined. (You set the font to bold by modifying the Font Weight property.)
Click the Add Existing Fields button in the Tools group to hide the property sheet and open the field list. Now drag the ContactDateTime, ContactEventTypeDescription, ContactNotes, ContactFollowUp, and ContactFollowUpDate fields from the field list and drop them into the Detail section one at a time.
Select the label for ContactDateTime, and then choose the Cut command in the Clipboard group on the Home tab (or press Ctrl+X) to separate the label from the control and move it to the Clipboard. Click the ContactID Header bar, and then click the Paste command in the Clipboard group (or press Ctrl+V) to paste the label in the upper-left corner of the ContactID Header section. Notice that you can now move the label independently in the ContactID Header section. (If you move the label before you separate it from its control, the control moves with it.) Separate the labels from the ContactEventTypeDescription, ContactNotes, ContactFollowUp, and ContactFollowUpDate controls one at a time, and move them to the ContactID Header section of the report.
Note As you paste each label, you’ll see warning smart tags appear that notify you that the labels aren’t associated with any control. This is useful to know when you create labels in the Detail section. But in this case, this is what you want, so click the smart tag and select the Ignore Error option to turn off the warning for each label.
-
Line up the column labels in the ContactID Header section, placing the Date / Time label near the left margin, the Contact Type label about 1.1 inches from the left margin, the Notes label about 2.75 inches from the left margin, the Follow Up? label about 4.5 inches from the left margin, and the Follow-Up Date label about 5.4 inches from the left margin. You can set these distances in the Left property of each label’s property sheet. Line up the tops of the labels by dragging a selection box around all five labels using the Select button in the Controls group on the Design tab and then clicking the Top command in the Control Alignment group on the Arrange tab.
-
You can enhance the appearance of the report by placing a line control across the bottom of the ContactID Header section. Click the Line button in the Controls group, and place a line in the ContactID Header section. To position this control at the bottom of the section, you need to find out the section’s height. Click the ContactID Header bar to select the section, open the property sheet, and find the Height property. Next, select the line control, and set the following properties: Left 0, Width 6.5, and Height 0. Set the Top property equal to the Height of the section. (It’s difficult to see this line in Figure 30–15, because it is hidden against the bottom of the section. You’ll see it when you switch to Print Preview.)
-
You can make the text box control for ContactDateTime smaller (about 0.9 inch), and you need to make the ContactEventTypeDescription text box control about 1.6 inches wide. Set the Text Align property for the ContactDateTime and ContactFollowUpDate text box controls to Left. Access sized the text box for the ContactNotes field too wide because ContactNotes is a Memo data type. Select the ContactNotes and ContactEventTypeDescription text box controls together, and click the To Narrowest button in the Size group on the Arrange tab to make the ContactNotes text box the same width as the ContactEventTypeDescription text box.
-
Align the text box controls for ContactDateTime, ContactEventTypeDescription, ContactNotes, ContactFollowUp, and ContactFollowUpDate under their respective labels. You can align each one by placing each text box control to the right of the left edge of its label, selecting them both (hold down the Shift key while selecting each one), and then left aligning them by clicking the Left button in the Control Alignment group on the Arrange tab. Align the ContactFollowUp check box control visually under the center of its label. Select all the controls in the Detail section and top align them by clicking the Top button in the same group.
-
The height of the Detail section determines the spacing between lines in the report. You don’t need much space between report lines, so make the Detail section smaller, until it’s only slightly higher than the row of controls for displaying your data. (About 0.3 inch should suffice.)
-
Expand the height of the ContactID Footer section and then add a text box in this section under the ContactFollowUpDate text box control and delete its attached label. To calculate the number of events, click the text box control, and in the Control Source property in the property sheet, enter
=Count([ContactID])
It’s a good idea to repeat the grouping information in the footer in case the detail lines span a page boundary. One way to do that is to add an expression in a text box. Add a second text box to the left of the first one (also delete its label) and stretch it to about 3.5 inches wide. Click the leftmost text box control to select it, and in the Control Source property in the property sheet, type
="Total contact events for " & [Contact] & ":"
Change the text box alignment to Right and change its font to Bold.
-
Add a second text box control in the ContactID Footer section under the first one. In the Control Source property in the property sheet, enter
= -Sum([ContactFollowUp])
Keep in mind that a True value in a yes/no field is the value −1. So, summing the values and then displaying the negative should give you a count of the contact events that require a follow-up. Click the attached label control and change the Caption property in the property sheet to
Number of events that require a follow-up:
Change Font Underline to No, right align the label, and size it to fit.
-
Add a line to the bottom of the ContactID Footer section to separate the end of the information about one contact from the next one. You can click the heading bar of the ContactID Footer to select the section and then look in the property sheet to find out the section’s height, which should be about 0.5 inch. Select the line again, and in the property sheet set Left to 0, Top to the height of the section, Width to 6.5, Height to 0, and Border Width (the thickness of the line) to 2 pt.
-
Click the Insert Page Number button in the Controls group on the Design tab to open the Page Numbers dialog box shown here.
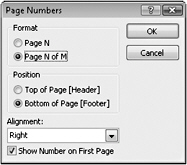
You want to display the current page number and the total number of pages on each page, so select the Page N Of M option under Format. The Page N option displays only the current page number. Next, to display these page numbers at the bottom of the report, select Bottom Of Page [Footer] under Position. The Top Of Page [Header] option places the control in the Page Header section of the report. In the Alignment list, select Right to display the page numbers on the right side of the page. The Left alignment option places the control that displays the page numbers on the left side of the report design grid, and the Center alignment option places the control in the center. The Inside alignment option places one control on the left side and one control on the right side of the report design grid. Access sets the Control Source property of these controls so that page numbers appear in the inside margin of pages in a bound book-odd page numbers appear on the left and even page numbers appear on the right. The Outside alignment option works just the opposite of Inside-even page numbers appear on the left and odd page numbers appear on the right.
Select the Show Number On First Page check box at the bottom of the dialog box to display the page numbers on all pages, including the first page. If you clear this check box, Access creates a control that will not show the page number on the first page. Click OK in the Page Numbers dialog box, and Access creates a new control in the Page Footer section.
-
Click the new text box control that you just created in the page footer, and look at the Control Source property in the property sheet. Access created the expression =“Page” & [Page] & “of” & [Pages] in the Control Source property of the text box. [Page] is a report property that displays the current page number. [Pages] is a report property that displays the total number of pages in the report. Finally, change the Text Align property to Right for this new control.
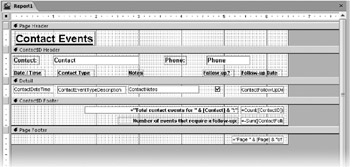
Figure 30–15: This is the completed Contact Events report that you will create in Design view.
After you finish, click the arrow below the View button in the Views group on the Ribbon and click Print Preview to see the result, shown in Figure 30–16. Notice in this figure that the detail lines are sorted in descending order by contact date/time. You’ll recall from Figure 30–14 that the grouping and sorting specifications include a request to sort within group on ContactDateTime.
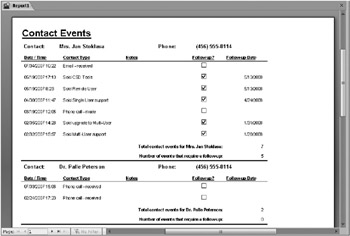
Figure 30–16: This is how your completed Contact Events report looks in Print Preview.
Now that you’ve seen how to create a report from scratch, you should have a good understanding of how to work with the individual design elements. In the remaining sections, we’ll show you how to get a jump-start on your report design using the quick create Report command, the Report Wizard, and the new Layout view. You’ll probably find that using one of these features is a good way to get a report started, and then you can use what you’ve learned thus far to fully customize your reports.
EAN: 2147483647
Pages: 299