Self Test
|
| < Day Day Up > |
|
| 1. | Which of the following is responsible for the quality of the project deliverables?
| |
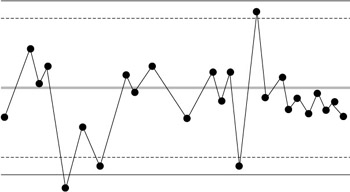
| 2. | What type of chart is this?
| |
| 3. | You are the project manager for the BBB Project. Stacy, a project team member, is confused about what QA is. Which of the following best describes QA?
| |
| 4. | You are the project manager for the Photo Scanning Project. This project is similar to another project you have completed. Your project is to electronically store thousands of historical photos for your city's historical society. Quality is paramount on this project. Management approaches you and asks why you have devoted so much of the project time for planning. Your response is which of the following?
| |
| 5. | You are the project manager for the Floor Installation Project. Today, you plan to meet with your project team to ensure the project is completed with no deviations from the project requirements. This process is which of the following?
| |
| 6. | You are the project manager for the ASE Project. This project must map to industry standards in order to be accepted by the customer. You and your team have studied the requirements and have created a plan to implement the deliverables with the appropriate level of quality. This process is called which of the following?
| |
| 7. | Which of the following is an example of internal failure cost?
| |
| 8. | QC is typically a(n) _________________ process.
| |
| 9. | QA is typically a(n) ____________________ process.
| |
| 10. | You are the project manager for a large manufacturer of wood furniture. Your new project is the Shop Table Project, which will be the creation and manufacturing of a new table for woodworkers to use in their wood shops. On this project you have elected to use JIT for scheduling. Which of the following is an advantage to using JIT?
| |
| 11. | Your company has elected to use ISO 9000 standards. What is an attribute of ISO 9000?
| |
| 12. | You are the project manager of the Halogen Installation Project. As this project gets underway, you receive notice from the program manager that the organization will be moving to Kaizen technologies as part of its quality management program. What are Kaizen technologies?
| |
| 13. | A fishbone diagram is the same as a(n) ______________________ chart.
| |
| 14. | Management has asked you to define the correlation between quality and the project scope. Which of the following is the best answer?
| |
| 15. | Which of the following is most true about quality?
| |
| 16. | _________________ is a business philosophy to find methods to continuously improve products, services, and business practices.
| |
| 17. | In quality management, which of the following is not an attribute of the cost of nonconformance?
| |
| 18. | You are the project manager for the KOY Project. This project requires quality that maps to federal guidelines. To ensure that you can meet these standards, you have elected to send the project team through training specific to the federal guidelines your project must adhere to. The costs of these classes can be assigned to which of the following?
| |
| 19. | You are the project manager for the KOY Project. This project requires quality that maps to federal guidelines. During a quality audit, you discovered that a portion of the project work is faulty and must be done again. The requirement to do the work is an example of which of the following?
| |
| 20. | Optimal quality is reached at what point?
| |
| 21. | You are the project manager of the JKL Project. The project is having some flaws in its production. Which analysis tool will allow you to determine the cause-and-effect of the production faults?
| |
| 22. | Linda is the project manager of a manufacturing project. She and her project team are using design of experiments to look for ways to improve quality. Which of the following best describes the method Linda and her team are using?
| |
| 23. | You are the project manager of the Global Upgrade Project. Your project team consists of 75 project team members around the world. Each project team will be upgrading a piece of equipment in many different facilities. Which of the following could you implement to ensure the project team members are completing all of the steps in the install procedure with quality?
| |
| 24. | Mark is the project manager of the PMH Project. Quality audits of the deliverables show there are several problems. Management has asked Mark to create a chart showing the distribution of problems and their frequencies. Management wants which of the following?
| |
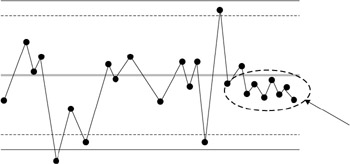
| 25. | In the following graphic, what does the highlighted area represent?
| |
Answers
| 1. | þ B. The project team (the individuals completing the project work) is responsible for the quality of the project deliverables. ý A is incorrect; the project champion may review the work, but the responsibility to quality does not lie with this individual. C and D are also incorrect choices; the customer and other stakeholders are not responsible for the quality of the project. |
| 2. | þ A. The chart shown is a control chart. ý B is incorrect since a Pareto diagram maps categories of issues and their frequency. C is incorrect; a scatter chart compares common values across multiple categories. D, a flow chart, is incorrect also; flow charts illustrate how a process moves through a system and how the components are interrelated. |
| 3. | þ A. QA is concerned with overall project quality performance. ý B, C, and D are incorrect because they do not correctly explain quality assurance. |
| 4. | þ C. Of all the choices presented, this is the best answer. Quality is planned into the project and the planning requires time. ý A is incorrect because a project of this nature has been completed before. B is incorrect because there is not enough information provided to determine what the quality demands of the project are. D is incorrect because quality audits are not part of the planning processes. |
| 5. | þ A. Quality planning should be completed prior to the work beginning-and thereafter be revisited as needed. ý B is incorrect as Quality management is not an applicable answer to the scenario; C and D are incorrect, because QA and QC are part of quality management. |
| 6. | þ A. Quality planning is the process of creating a plan to meet the requirements of quality. ý Choices B, C, and D are incorrect because they do not explain the process in the questions scenario. |
| 7. | þ A. Internal failure cost is attributed to failure that results in rework. It is an example of the cost of nonconformance to quality. ý B and C are incorrect; quality audits are not a cost associated with nonconformance. D is incorrect because project team training is an example of the cost of conformance to quality. |
| 8. | þ D. QC requires an inspection of the work results. While quality is planned into a project, inspections ensure it exists. ý A is incorrect; QA is a managerial function. B is incorrect because another department, team member, or SME can complete QC. C is incorrect; an audit is too broad an answer for this question. Audits can be financial, schedule, or quality driven. |
| 9. | þ A. QA is typically a management process. ý B is incorrect because another department, team member, or SME can complete QC. C is incorrect because an audit is too broad of an answer for this question. Audits can be financial, schedule, or quality driven. D is wrong because QA is typically not an inspection process. |
| 10. | þ C. JIT, just-in-time scheduling, decreases the investment in inventory. However, mistakes with the materials can cause downtime if no additional materials are on hand. ý A is incorrect because materials are only available when they are needed. B is incorrect; the project team must use caution not to waste the materials. D is incorrect because JIT does not allow a broad range of deviation. |
| 11. | þ A. ISO 9000 is not a quality management system, but a system to ensure an organization follows its own quality procedures. ý B, C, and D are all incorrect. These choices do not correctly describe ISO 9000. |
| 12. | þ C. Kaizen technologies are small changes to processes and products on a steady, continuous basis to save costs and improve quality. ý A is incorrect; while Kaizen does implement small process changes, it does not aim for small results. B and D are also incorrect. Kaizen does not have to be implemented in all projects, though it often is. Kaizen is also not interested in necessarily reducing the project duration. |
| 13. | þ A. A fishbone diagram is the same as an Ishikawa diagram. ý B, C, and D are incorrect; these charts and diagrams accomplish goals other than the cause-and-effect of the Ishikawa. |
| 14. | þ C. Quality, in regard to the project scope, is about completing the work as promised. ý A is incorrect; the project scope will have requirements for acceptance, but may not have metrics for quality defined. B and D are also incorrect. |
| 15. | þ D. Quality is prevention driven. Quality wants to complete the work correctly the first time to prevent poor results, loss of time, and loss of funds. ý A and B are incorrect; there is no guarantee that a project will cost more or less depending on the amount of expected quality. Incidentally, lack of quality will likely cost more than quality planning because of the cost of nonconformance. C is incorrect because quality is planned into a project, not inspected in. |
| 16. | þ A. TQM, Total Quality Management, is a business philosophy to find methods to continuously improve. ý B, ASQ (American Society of Quality) is not a business philosophy. C and D are attributes of TQM, but are not correct answers for this question. |
| 17. | þ C. A safety measure is not an attribute of the cost of nonconformance, but rather a cost of adhering to quality. ý A, B, and D are incorrect choices; these are all attributes of the cost of nonconformance. |
| 18. | þ B. Training to meet the quality expectations are attributed to the cost of quality. ý A, C, and D are incorrect because these choices do not describe training as a cost of quality. |
| 19. | þ C. When project work results are faulty and must be done over, it is attributed to the cost of nonconformance to quality. ý A, B, and D are all incorrect; these values do not describe faulty work or the cost of nonconformance. |
| 20. | þ C. Marginal analysis provides that optimal quality is reached when the cost of the improvements equals the incremental costs to achieve the quality. ý A, B, and D are incorrect. These answers do not describe marginal analysis. |
| 21. | þ C. The key words 'cause-and-effect' equate to the Ishikawa diagram. ý A is incorrect; a flow chart will show how a process moves through the system, but not the cause-and-effect of the problems involved. B is incorrect as well. A Pareto chart maps out the causes and frequency of problems. D, a control chart, plots out the results of sampling, but does not show the cause-and-effect of problems. |
| 22. | þ C. Of all the choices presented, C is the best. Design of experiments uses experiments and 'what-if' scenarios to determine what variables are affecting quality. ý A is incorrect because design of experiments, in regard to quality, is not interested in changing the relationship of activities to complete project work. B and D are also incorrect because design of experiments will not be changing project design to determine where flaws exist or to become more productive. |
| 23. | þ A. Checklists are simple but effective quality management tools that the project manager can use to ensure the project team is completing the required work. ý B, C, and D are all incorrect. The WBS, PND, and WBS dictionary are not tools the project team can necessarily use to prove they've completed required work. Checklists are the best approach for this scenario. |
| 24. | þ C. Management wants Mark to create a Pareto diagram. Recall that a Pareto diagram maps out the causes of defects and illustrates their frequency. ý A is incorrect because a control chart does not identify the problems, only the relation of the results to the expected mean. B is incorrect because a cause-and-effect diagram does not map out the frequency of problems. D is also incorrect; flow charts show how a process moves through a system and how the components are related. |
| 25. | þ C. The highlighted area shows seven consecutive sampling results all on one side of the mean; this is known as the rule of seven and is an assignable cause. ý A is incorrect; these values are in control. B is correct, but it does not fully answer the question as choice C does. D is incorrect; standard deviation is a predicted measure of the variance from the expected mean of a sampling. |
|
| < Day Day Up > |
|
EAN: 2147483647
Pages: 209