Completing Qualitative Analysis
|
| < Day Day Up > |
|
Not all risks are worth responding to while others demand attention. Qualitative analysis is a subjective approach to organizing and prioritizing risks. Through a methodical and logical approach, the identified risks are rated according to probability and potential impact.
The outcome of the ranking determines four things:
-
It identifies the risks that require additional analysis through quantitative risk analysis.
-
It identifies the risks that may proceed directly to risk response planning.
-
It identifies risks that are not critical, project-stopping risks, but that still must be documented.
-
It prioritizes risks.
Applying Probability and Impact
The project risks are rated according to their probability and impact. Risk probability is the likelihood that a risk event may happen, while risk impact is the consequence that the result of the event will have on the project objectives. Each risk is measured based on its likelihood and its impact. There are two approaches to ranking risks:
-
Cardinal scales identify the probability and impact on a numerical value from .01 (very low) to 1.0 (certain).
-
Ordinal scales identify and rank the risks as very high to very unlikely.
Creating a Probability-Impact Matrix
Each identified risk is fed into a probability-impact matrix, as seen in Figure 11-4. The matrix maps out the risk, its probability and possible impact. The risks with higher probability and impact are a more serious threat to the project objectives than the risks with lower impact and consequences. The risks that are threats to the project require quantitative analysis to determine the root of the risks, the methods to control the risks, and effective risk management. We’ll discuss quantitative risk management later in this chapter.
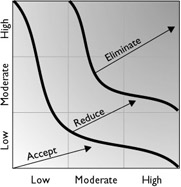
Figure 11-4: A probability-impact matrix measures the identified risks within the project.
The project is best served when the probability scale and the impact scale are predefined prior to qualitative analysis. For example, the probability scale rates the likelihood of an individual risk happening and can be on a linear scale (.1, .3, .5, .7, .9) or the scale can be the ordinal scale. The scale, however, should be defined and agreed upon in the risk management plan. The impact scale, which measures the severity of the risk on the project’s objectives, can also be ordinal or cardinal.
The value of identifying and assigning the scales to use prior to the process of qualitative analysis allows all risks to be ranked by the system and allows for future identified risks to be measured and ranked by the same system. A shift in risk rating methodologies mid-project can cause disagreements in the method of handling the project risks.
A probability-impact matrix, as seen in Figure 11-5, multiples the value for the risk probability by the risk impact for a total risk score. For example, an identified risk in a project is the possibility that the vendor may be late in delivering the hardware. The probability is rated at .9, but the impact of the risk on the project is rated at .10. The risk score is calculated by multiplying the probability times the impact—in this case, resulting in a score of .09.
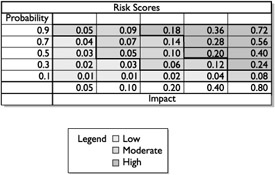
Figure 11-5: A probability-impact matrix scores the identified risks.
The scores within the probability-impact matrix can be referenced against the performing organization’s policies for risk reaction. Based on the risk score, the performing organization can place the risk in differing categories to guide risk reaction. There are three common categories based on risk score:
-
Red condition High risk; these risks scores are high in impact and probability.
-
Yellow condition These risks are somewhat high in impact and probability.
-
Green condition Risks with a green label are generally fairly low in impact, probability, or both.
| On the Job | Your organization may not have a classification of risks of red, yellow, and green. Your project risks should map to the methodology your organization uses to identify and classify project risks. If there is no classification of risks, take initiative and create one for your project. Be certain to document your classification for historical information and include this information in your Lessons Learned documentation. |
Testing the Assumptions
False assumptions can ruin the project. A false assumption can wreck time, cost, and even the quality of a project deliverable. Assumptions, for this reason, are treated as risks and must be tested and weighed to truncate the possibility of an assumption turning against the project. Assumptions are weighed using two factors:
-
Assumption stability How reliable is the information that led to this assumption?
-
Assumption consequence What is the effect on the project if this assumption is false?
The answers to these two questions will help the project team be able to deliver the project with more confidence. Should an assumption prove to be false, the weight of the assumption consequence may be low to high—depending on the nature of the assumption.
Relying on Data Precision
One of the toughest parts of qualitative risk analysis is the biased, subjective nature of the process. A project manager and the project team must question the reliability and reality of the data that lead to the ranking of the risks. For example, Susan may have very high confidence in herself to work with a new, unproven technology. Based on this opinion, she petitions the probability of the work to be a very low score.
However, because she has no experience with the technology due to its newness, the probability of the risk of failure is actually very high. The biased opinion that Susan can complete the work with zero defects and problems is slightly skewed because she has never worked with the technology before. Obviously, a low-ranked score on a risk that should be ranked high can have detrimental effects on the project’s success.
Data precision ranking takes into consideration the biased nature of the ranking, the accuracy of the data submitted, and the reliability of the nature submitted to examine the risk scores. Data precision ranking is concerned with:
-
The level of understanding of the project risk
-
The available data and information about the identified risk
-
The quality of the data and information of the identified risk
-
The reliability of the data about the identified risk
|
| < Day Day Up > |
|
EAN: 2147483647
Pages: 209