Section 8.2. Risk Analysis
8.2. Risk AnalysisGood, effective security planning includes a careful risk analysis. A risk is a potential problem that the system or its users may experience. We distinguish a risk from other project events by looking for three things, as suggested by Rook [ROO93]:
We usually want to weigh the pros and cons of different actions we can take to address each risk. To that end, we can quantify the effects of a risk by multiplying the risk impact by the risk probability, yielding the risk exposure. For example, if the likelihood of virus attack is 0.3 and the cost to clean up the affected files is $10,000, then the risk exposure is $3,000. So we can use a calculation like this one to decide that a virus checker is worth an investment of $100, since it will prevent a much larger potential loss. Clearly, risk probabilities can change over time, so it is important to track them and plan for events accordingly. Risk is inevitable in life: Crossing the street is risky but that does not keep us from doing it. We can identify, limit, avoid, or transfer risk but we can seldom eliminate it. In general, we have three strategies for dealing with risk:
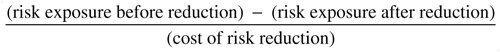
Thus, costs are associated not only with the risk's potential impact but also with reducing it. Risk leverage is the difference in risk exposure divided by the cost of reducing the risk. In other words, risk leverage is If the leverage value of a proposed action is not high enough, then we look for alternative but less costly actions or more effective reduction techniques. Risk analysis is the process of examining a system and its operational context to determine possible exposures and the potential harm they can cause. Thus, the first step in a risk analysis is to identify and list all exposures in the computing system of interest. Then, for each exposure, we identify possible controls and their costs. The last step is a costbenefit analysis: Does it cost less to implement a control or to accept the expected cost of the loss? In the remainder of this section, we describe risk analysis, present examples of risk analysis methods, and discuss some of the drawbacks to performing risk analysis. The Nature of RiskIn our everyday lives, we take risks. In crossing the road, eating oysters, or playing the lottery, we take the chance that our actions may result in some negative resultsuch as being injured, getting sick, or losing money. Consciously or unconsciously, we weigh the benefits of taking the action with the possible losses that might result. Just because there is a risk to a certain act we do not necessarily avoid it; we may look both ways before crossing the street, but we do cross it. In building and using computing systems, we must take a more organized and careful approach to assessing our risks. Many of the systems we build and use can have a dramatic impact on life and health if they fail. For this reason, risk analysis is an essential part of security planning. We cannot guarantee that our systems will be risk free; that is why our security plans must address actions needed should an unexpected risk become a problem. And some risks are simply part of doing business; for example, as we have seen, we must plan for disaster recovery, even though we take many steps to avoid disasters in the first place. When we acknowledge that a significant problem cannot be prevented, we can use controls to reduce the seriousness of a threat. For example, you can back up files on your computer as a defense against the possible failure of a file storage device. But as our computing systems become more complex and more distributed, complete risk analysis becomes more difficult and time consumingand more essential. Steps of a Risk AnalysisRisk analysis is performed in many different contexts; for example, environmental and health risks are analyzed for activities such as building dams, disposing of nuclear waste, or changing a manufacturing process. Risk analysis for security is adapted from more general management practices, placing special emphasis on the kinds of problems likely to arise from security issues. By following well-defined steps, we can analyze the security risks in a computing system. The basic steps of risk analysis are listed below.
Sidebar 8-3 illustrates how different organizations take slightly different approaches, but the basic activities are still the same. These steps are described in detail in the following sections. Step 1: Identify AssetsBefore we can identify vulnerabilities, we must first decide what we need to protect. Thus, the first step of a risk analysis is to identify the assets of the computing system. The assets can be considered in categories, as listed below. The first three categories are the assets identified in Chapter 1 and described throughout this book. The remaining items are not strictly a part of a computing system but are important to its proper functioning.
It is essential to tailor this list to your own situation. No two organizations will have the same assets to protect, and something that is valuable in one organization may not be as valuable to another. For example, if a project has one key designer, then that designer is an essential asset; on the other hand, if a similar project has ten designers, any of whom could do the project's design, then each designer is not as essential because there are nine easily available replacements. Thus, you must add to the list of assets the other people, processes, and things that must be protected. For example, RAND Corporation's Vulnerability Assessment and Mitigation (VAM) methodology [ANT02] includes additional assets, such as
The VAM methodology is a process supported by a tool to help people identify assets, vulnerabilities, and countermeasures. We use other aspects of VAM as an example technique in later risk analysis steps. In a sense, the list of assets is an inventory of the system, including intangibles and human resource items. For security purposes, this inventory is more comprehensive than the traditional inventory of hardware and software often performed for configuration management or accounting purposes. The point is to identify all assets necessary for the system to be usable. Step 2: Determine VulnerabilitiesThe next step in risk analysis is to determine the vulnerabilities of these assets. This step requires imagination; we want to predict what damage might occur to the assets and from what sources. We can enhance our imaginative skills by developing a clear idea of the nature of vulnerabilities. This nature derives from the need to ensure the three basic goals of computer security: confidentiality, integrity, and availability. Thus, a vulnerability is any situation that could cause loss of confidentiality, integrity, and availability. We want to use an organized approach to considering situations that could cause these losses for a particular object. Software engineering offers us several techniques for investigating possible problems. Hazard analysis, described in Sidebar 8-4, explores failures that may occur and faults that may cause them. These techniques have been used successfully in analyzing safety-critical systems. However, additional techniques are tailored specifically to security concerns; we address those techniques in this and following sections.
To organize the way we consider threats and assets, we can use a matrix such as the one shown in Table 8-2. One vulnerability can affect more than one asset or cause more than one type of loss. The table is a guide to stimulate thinking, but its format is not rigid.
In thinking about the contents of each matrix entry, we can ask the following questions.
Table 8-3 is a version of the previous table with some of the entries filled in. It shows that certain general problems can affect the assets of a computing system. In a given installation, it is necessary to determine what can happen to specific hardware, software, data items, and other assets.
Some organizations use other approaches to determining vulnerabilities and assessing their importance. For example, Sidebar 8-5 describes the U.S. Navy's approach to vulnerability evaluation. Alas, there is no simple checklist or easy procedure to list all vulnerabilities. But from the earlier chapters of this book you have seen many examples of vulnerabilities to assets, and your mind has been trained to think of harm that can occur. Tools can help us conceive of vulnerabilities by providing a structured way to think. For example, RAND's VAM methodology suggests that assets have certain properties that make them vulnerable. The properties exist in three categories: aspects of the design or architecture, aspects of behavior, and general attributes. Table 8-4 lists these properties in more detail. Notice that the properties apply to many kinds of systems and at various places within a given system.
These attributes can be used to build a matrix, each of whose entries may suggest one or more vulnerabilities. An example of such a matrix is shown in Figure 8-2. Using that matrixfor example, the design attribute limits, finiteness applied to a cyber object, a software programcould lead you to suspect buffer overflow vulnerabilities, or uniqueness for a hardware object could signal a single point of failure. To use this methodology you would work through the matrix, thinking of each contributing attribute on each asset class to derive the set of vulnerabilities. Figure 8-2. Vulnerabilities Suggested by Attributes and Objects. (From [ANT02], copyright © RAND 2002, reprinted by permission.)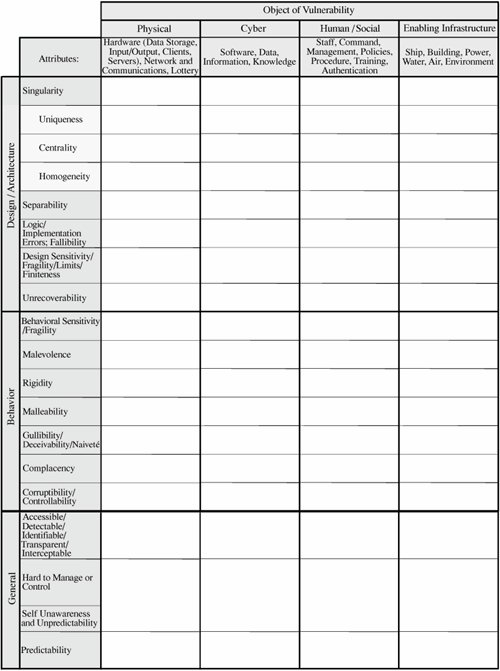 Antón et al. [ANT02] point out that it is not enough to fill in the matrix cells. We must also consider combinations of situations that might enable certain vulnerabilities. For example, as Figure 8-3 shows, at least six attributes can allow a successful attack by Trojan horse. The homogeneity of the design or architecture may encourage an attacker to place a Trojan horse in a well-understood location. The horse may be loaded by a gullible user who downloads a seemingly benign file. To do this, the attacker must have some control over users and their machines; in general, this is a manifestation of the accessibility of systems, especially on the Internet, and the lack of user awareness when a remote site sends data to an unsuspecting system. Figure 8-3. Vulnerabilities Enabling a Trojan Horse Attack. (From [ANT02], copyright © RAND 2002, reprinted by permission.)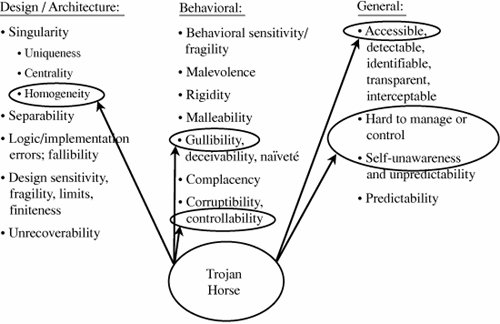 Step 3: Estimate Likelihood of ExploitationThe third step in conducting a risk analysis is determining how often each exposure is likely to be exploited. Likelihood of occurrence relates to the stringency of the existing controls and the likelihood that someone or something will evade the existing controls. Sidebar 8-6 describes several approaches to computing the probability that an event will occur: classical, frequency, and subjective. Each approach has its advantages and disadvantages, and we must choose the approach that best suits the situation (and its available information). In security, it is often not possible to directly evaluate an event's probability by using classical techniques. However, we can try to apply frequency probability by using observed data for a specific system. Local failure rates are fairly easy to record, and we can identify which failures resulted in security breaches or created new vulnerabilities. In particular, operating systems can track data on hardware failures, failed login attempts, numbers of accesses, and changes in the sizes of data files. Another alternative is to estimate the number of occurrences in a given time period. We can ask an analyst familiar with the system to approximate the number of times a described event occurred in the last year, for example. Although the count is not exact (because the analyst is unlikely to have complete information), the analyst's knowledge of the system and its usage may yield reasonable estimates. Of course, the two methods described depend on the fact that a system is already built and has been in use for some period of time. In many cases, and especially for proposed systems, the usage data are not available. In this case, we may ask an analyst to estimate likelihood by reviewing a table based on a similar system; this approach is incorporated in several formal security risk processes. For example, the analyst may be asked to choose one of the ratings shown in Table 8-5. Completing this analysis depends on the rater's professional expertise. The table provides the rater with a framework within which to consider each likelihood. Differences between close ratings are not very significant. A rater should be able to distinguish between something that happens once a year and once a month.
The Delphi approach is a subjective probability technique originally devised by RAND [HAL67] to deal with public policy decisions. It assumes that experts can make informed estimates based on their experience; the method brings a group of experts to consensus. The first step in using Delphi is to provide each of several experts with information describing the situation surrounding the event under consideration. For example, the experts may be told about the software and hardware architecture, conditions of use, and expertise of users. Then, each expert individually estimates the likelihood of the event. The estimates are collected, reproduced, and distributed to all experts. The individual estimates are listed anonymously, and the experts are usually given some statistical information, such as mean or median. The experts are then asked whether they wish to modify their individual estimates in light of values their colleagues have supplied. If the revised values are reasonably consistent, the process ends with the group's reaching consensus. If the values are inconsistent, additional rounds of revision may occur until consensus is reached.
Step 4: Compute Expected LossBy this time, we have gained an understanding of the assets we value, their possible vulnerabilities, and the likelihood that the vulnerabilities will be exploited. Next, we must determine the likely loss if the exploitation does indeed occur. As with likelihood of occurrence, this value is difficult to determine. Some costs, such as the cost to replace a hardware item, are easy to obtain. The cost to replace a piece of software can be approximated reasonably well from the initial cost to buy it (or specify, design, and write it). However, we must take care to include hidden costs in our calculations. For instance, there is a cost to others of not having a piece of hardware or software. Similarly, there are costs in restoring a system to its previous state, reinstalling software, or deriving a piece of information. These costs are substantially harder to measure. In addition, there may be hidden costs that involve legal fees if certain events take place. For example, some data require protection for legal reasons. Personal data, such as police records, tax information, census data, and medical information, are so sensitive that there are criminal penalties for releasing the data to unauthorized people. Other data are company confidential; their release may give competitors an edge on new products or on likely changes to the stock price. Some financial data, especially when they reflect an adverse event, could seriously affect public confidence in a bank, an insurance company, or a stock brokerage. It is difficult to determine the cost of releasing these data. If a computing system, a piece of software, or a key person is unavailable, causing a particular computing task to be delayed, there may be serious consequences. If a program that prints paychecks is delayed, employees' confidence in the company may be shaken, or some employees may face penalties from not being able to pay their own bills. If customers cannot make transactions because the computer is down, they may choose to take their business to a competitor. For some time-critical services involving human lives, such as a hospital's life-support systems or a space station's guidance systems, the costs of failure are infinitely high. Thus, we must analyze the ramifications of a computer security failure. The following questions can prompt us to think about issues of explicit and hidden cost related to security. The answers may not produce precise cost figures, but they will help identify the sources of various types of costs.
These are not easy costs to evaluate. Nevertheless, they are needed to develop a thorough understanding of the risks. Furthermore, the vulnerabilities in computer security are often considerably higher than managers expect. Realistic estimates of potential harm can raise concern and suggest places in which attention to security is especially needed. Step 5: Survey and Select New ControlsBy this point in our risk analysis, we understand the system's vulnerabilities and the likelihood of exploitation. We turn next to an analysis of the controls to see which ones address the risks we have identified. We want to match each vulnerability with at least one appropriate security technique, as shown in Figure 8-4. Once we do that, we can use our expected loss estimates to help us decide which controls, alone or in concert, are the most cost effective for a given situation. Notice that vulnerabilities E and F are countered by primary techniques 2 and 4, respectively. The secondary control techniques 2 and 3 for vulnerability F are good defense in depth. The fact that there is no secondary control for vulnerability E is a minor concern. But vulnerability T is a serious caution, because it has no control whatsoever. Figure 8-4. Mapping Control Techniques to Vulnerabilities. (Adapted from [ANT02], copyright © RAND 2002, reprinted by permission.) For example, consider the risk of losing data. This loss could be addressed by several of the controls we have discussed in previous chapters: periodic backups, redundant data storage, access controls to prevent unauthorized deletion, physical security to keep someone from stealing a disk, or program development standards to limit the effect of programs on the data. We must determine the effectiveness of each control in a given situation; for instance, using physical security in a building already equipped with guards and limited access may be more effective than sophisticated software-based controls. What Criteria Are Used for Selecting Controls?We can also think of controls at a different level. Table 8-6 lists a selection of strategies presented in the VAM methodology; we can use the list to mitigate the effects of a vulnerability. This method reflects a systems approach and also the military defense environment for which VAM was developed.
VAM characterizes controls in terms of four high-level aspects: resilience and robustness; intelligence, surveillance, reconnaissance (ISR), and self-awareness; counterintelligence, denial of ISR, and target acquisition; and deterrence and punishment. Notice that many of these controls are technical but embrace the entire system architecture. For example, heterogeneity is a control that can be implemented only when the system is designed so that it is composed of dissimilar pieces, such as operating systems of different brands. Similarly, redundancy and decentralization are architectural elements, too. Some people think of controls as specific pieces of hardware and software, such as firewalls and virus checkers. But in fact, this broader list takes a software engineering approach to security: Make the system sturdy from the beginning, rather than trying only to patch holes with security-specific, self-contained subsystems. The VAM methodology takes this table one step further, using it to compare vulnerabilities to possible controls. The matrix shown in Figure 8-5 lists attributes leading to vulnerabilities (as seen in Table 8-4) along the left side, and the controls of Table 8-6 along the top. Thus, each cell of the matrix corresponds to whether a particular control addresses a given vulnerability. Figure 8-5. Matrix of Vulnerabilities and Controls. (From [ANT02], copyright © RAND 2002, reprinted by permission.)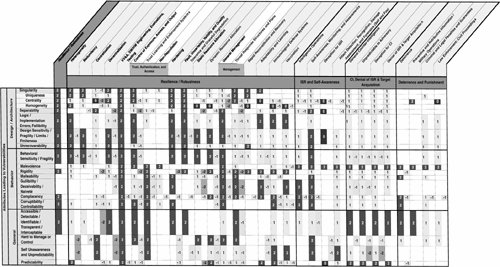 How Do Controls Affect What They Control?Controls have positive and negative effects: Encryption, for example, protects confidentiality, but it also takes time and introduces key management issues. Thus, when selecting controls, you have to consider the full impact. The creators of VAM recognized that sometimes attributes enhance security and other times detract from it. For example, heterogeneity may be useful as a control in preventing the proliferation of the same kind of logic error throughout a system. But heterogeneity can also make the system's design harder to understand and, therefore, harder to maintain; the result can be a fragile design that is easy for an attacker to cause to fail. For this reason, VAM has included a rating scheme to reflect the relationship depicted by each cell of the matrix. A cell relating a vulnerability to a security technique contains a number from 2 to 2, according to this scheme:
The VAM rating scheme is depicted in Figure 8-6; the full explanation of each row name, column name and rating can be found in [ANT02]. The matrix is used to support decisions about controls in the following way. We begin with the rows of the matrix, each of which corresponds to a vulnerability. We follow the row across to look for instances in which a cell is labeled with a 2 (or a 1, if there are no 2s). Then we follow the column up to its heading, to see which security techniques (the column labels) are strong controls for this vulnerability. For example, the matrix indicates that heterogeneity, redundancy, and decentralization are good controls for design sensitivity or fragility. Next, we notice that both heterogeneity and decentralization are also labeled with a -1 in that cell, indicating that by using them, we may enable other vulnerabilities. For instance, heterogeneity can enable several systems to complement each other but can make the overall system harder to maintain. Similarly, decentralization makes it more difficult for an attacker to exploit fragilities, but at the same time it can make the system more fragile due to a need for coordination. In this way, we can look at the implications of using each control to address known vulnerabilities. Figure 8-6. Valuation of Security Techniques. (From [ANT02], copyright © RAND 2002, reprinted by permission.)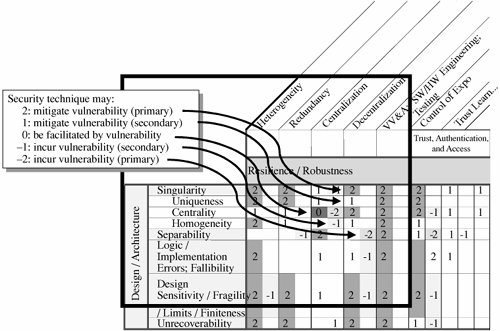 Which Controls Are Best?By now, we have noted a large number of primary and secondary controls to use against our identified vulnerabilities. We need a way to determine the most appropriate controls for a given situation. VAM offers us a refinement process based on three roles: operational, design, and policy. That is, if we are interested in security from the perspective of someone who will be using or managing the system, we take the operational perspective. If instead we view security from an implementation point of view, we take the developer's role. And if we view the system in the larger context of how it provides information processing to relevant organizations, we adopt the policy point of view. VAM provides tables, such as the one shown in Figure 8-7, to identify the relevance of each control to each perspective. Figure 8-7. Relevance of Certain Security Techniques to Roles and Attack Components. (From [ANT02], copyright © RAND 2002, reprinted by permission.)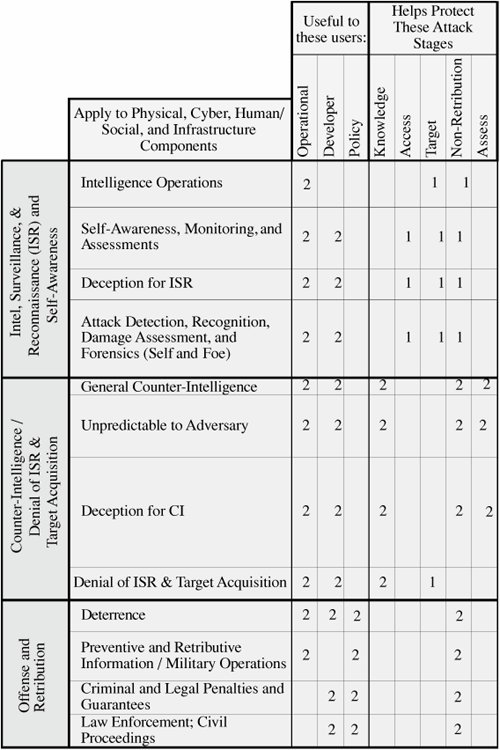 In this matrix, the rows represent security controls, and the columns serve two functions. The first three columns represent the three perspectives for evaluating the relevance of the control: operational, developer, and policy. The second five columns note at what stage of an attack the control is most useful: allowing an attacker to have knowledge about the system, enabling access to the system, providing a target for attack, enabling nonretribution, and assessing the extent to which an attack has been successful. In this matrix, the 1s and 2s labeling the cells have a different meaning from the previous matrix. Here, a 1 indicates that the control is weakly relevant to the perspective or attack stage, and a 2 indicates that it is strongly relevant. Finally, VAM presents a matrix to illustrate the relationships among the attack stages and the vulnerable objects in a system. For example, an attacker can gain knowledge about a system not only by obtaining source code and doing reverse engineering but also by using organizational charts and social engineering. The VAM approach is comprehensive and effective, supported by a software tool to walk an analyst through the stages of identifying vulnerabilities, selecting controls, and refining choices. [ANT02] contains tables and charts that explain the rating system and the relationships among tables; we have presented some of those tables and charts, courtesy of Antón et al., because they offer good examples that introduce you to the details of selecting controls. Sometimes, however, you can do a much less rigorous analysis by simply listing the possible controls, assessing the strengths and weaknesses of each, and choosing the one(s) that seem to be most appropriate. Step 6: Project SavingsBy this point in our risk analysis, we have identified controls that address each vulnerability in our list. The next step is to determine whether the costs outweigh the benefits of preventing or mitigating the risks. Recall that we multiply the risk probability by the risk impact to determine the risk exposure. The risk impact is the loss that we might experience if the risk were to turn into a real problem. There are techniques to help us determine the risk exposure. The effective cost of a given control is the actual cost of the control (such as purchase price, installation costs, and training costs) minus any expected loss from using the control (such as administrative or maintenance costs). Thus, the true cost of a control may be positive if the control is expensive to administer or introduces new risk in another area of the system. Or the cost can even be negative if the reduction in risk is greater than the cost of the control. For example, suppose a department has determined that some users have gained unauthorized access to the computing system. It is feared that the intruders might intercept or even modify sensitive data on the system. One approach to addressing this problem is to install a more secure data access control program. Even though the cost of the access control software is high ($25,000), its cost is easily justified when compared to its value, as shown in Table 8-7. Because the entire cost of the package is charged in the first year, even greater benefits are expected for subsequent years.
Another company uses a common carrier to link to a network for certain computing applications. The company has identified the risks of unauthorized access to data and computing facilities through the network. These risks can be eliminated by replacement of remote network access with the requirement to access the system only from a machine operated on the company premises. The machine is not owned; a new one would have to be acquired. The economics of this example are not promising, as shown in Table 8-8.
To supplement this tabular analysis, we can use a graphical depiction to contrast the economics involved in choosing among several strategies. For example, suppose we are considering the use of regression testing after making an upgrade to fix a security flaw. Regression testing means applying tests to verify that all remaining functions are unaffected by the change. It can be an expensive process, especially for large systems that implement many functions. (This example is taken from Pfleeger and Atlee [PFL06a].) To help us make our decision, we draw a diagram such as that in Figure 8-8. We want to compare the risk impact of doing regression testing with not doing it. Thus, the upper part of the diagram shows the risks in doing regression testing, and the lower part the risks of not doing regression testing. In each of the two cases, one of three things can happen: We find a critical fault, there is a critical fault but we miss finding it, or there are no critical faults to be found. For each possibility, we first calculate the probability of an unwanted outcome, P(UO). Then, we associate a loss with that unwanted outcome, L(UO). Thus, in our example, if we do regression testing and miss a critical fault lurking in the system (a probability of 0.05), the loss could be $30 million. Multiplying the two, we find the risk exposure for that strategy to be $1.5 million. As you can see from the calculations in the figure, it is far safer to do the regression testing than to skip it. Figure 8-8. Risk Calculation for Regression Testing.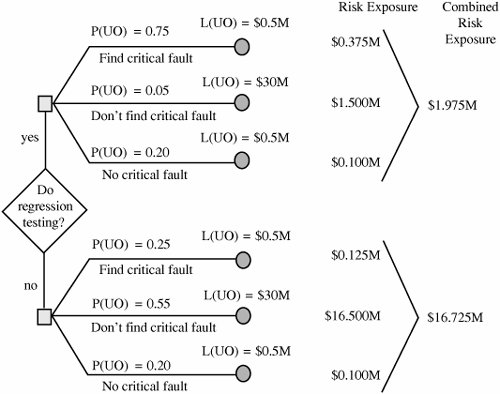 As shown in these examples, risk analysis can be used to evaluate the true costs of proposed controls. In this way, risk analysis can be used as a planning tool. The effectiveness of different controls can be compared on paper before actual investments are made. Risk analysis can thus be used repeatedly, to select an optimum set of controls. Arguments For and Against Risk AnalysisRisk analysis is a well-known planning tool, used often by auditors, accountants, and managers. In many situations, such as obtaining approval for new drugs, new power plants, and new medical devices, a risk analysis is required by law in many countries. There are many good reasons to perform a risk analysis in preparation for creating a security plan.
However, despite the advantages of risk analysis, there are several arguments against using it to support decision making.
This lack of accuracy is often cited as a deficiency of risk analysis. But this lack is a red herring. Risk analysis is useful as a planning tool, to compare and contrast options. We may not be able to predict events accurately, but we can use risk analysis to weigh the tradeoffs between one action and another. When risk analysis is used in security planning, it highlights which security expenditures are likely to be most cost effective. This investigative basis is important for choosing among controls when money available for security is limited. And our risk analysis should improve as we build more systems, evaluate their security, and have a larger experience base from which to draw our estimates. A risk analysis has many advantages as part of security plan or as a tool for less formal security decision making. It ranges from very subjective and imprecise to highly quantitative. It is useful for generating and documenting thoughts about likely threats and possible countermeasures. Finally, it supports rational decision making about security controls. Next we turn to another aspect of security planningdeveloping security policies. | |||||||||||||||||||||||||||||||||||||||||||||||||||||||||||||||||||||||||||||||||||||||||||||||||||||||||||||||||||||||||||||||||||||||||||||||||||||||||||||||||||||||||||||||||||||||||||||||||||||||||||||||||||||||||
EAN: 2147483647
Pages: 171