Hack83.Measure the Checkout Process
Hack 83. Measure the Checkout Process
Improvements in the online checkout processes have yielded more incremental revenue than almost any other aspect of web site measurement. The checkout process is the most important process for any retail site to optimize. Luckily, it is also the easiest to analyze, and the improvement opportunities uncovered through analysis are extremely tangible. Following this simple framework will allow you to identify changes that have allowed retailers to make up their investment in these enhancements during the first day post implementation! 6.4.1. Step One: Establish a BaselineThe first step is establishing a baseline, as well as a method for monitoring the checkout process performance efficiently and on a periodic basis. There are two high-level metrics that should be trended and provide an excellent baseline:
In terms of monitoring the checkout process itself, you should go one level deeper and look at what is happening at each step. The metrics you need to pay attention to at each step in the checkout process include:
Keep in mind that measuring the checkout process is really just a specific variation on measuring multi-step processes [Hack #59]. Vendors will often provide each of these metrics in a single report, detailing the checkout process step by step (Figure 6-3). Figure 6-3. Checkout funnel analysis report For each step, you now know the likelihood of a customer moving forward in the process versus leaving the process or, even worse, leaving the site altogether. In addition, you immediately see the financial impact of losing these customers. Hopefully, most of you are saying, "That's great, but how can I stop this mass exodus from my checkout process?" 6.4.2. Step Two: Diagnose ProblemsNext you need to diagnose the problems that are causing the attrition described above. The key to this diagnostic analysis is to uncover where people are going when they are not moving forward. In many cases, this will allow you to form some hypotheses around the root cause of these movements. The ultimate diagnostic data source for this analysis is clickstream data, which lays out the exact path customers are taking from each step in the process. It is useful to characterize these movements into the following buckets:
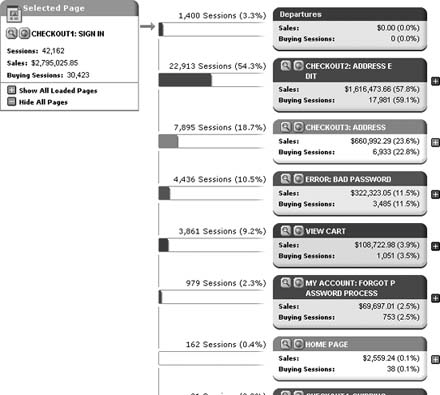
We recommend that you generate a flow chart of the checkout process with the metrics above included for each step. You'll already know where the big attrition points are, but now you can get closer to what is driving the attrition and see whether it is backward or non-process movements that are causing the problem. The next question you should ask is "Which is worse?" Most web measurement vendors provide some type of clickstream analysis designed to provide you with the data you need to fully diagnose abandonment in your checkout process in a visual way (Figure 6-4). These reports are variations on the table of information described above and presented in Figure 6-3, designed to highlight problems around a single page in the processin this case, exploring how many sales and orders are driven by people clicking from the "Checkout1: Sign In" page. Figure 6-4. Clickstream report of page flow on a per-session (visit) basis Reports and visualizations like this one can help you better diagnose problems that are highlighted by tables like the one in Figure 6-3. You'd be surprised at how valuable the ability to visually explore this information can be, yielding key insights like:
6.4.3. Bringing It All TogetherIn summary, the methodology for measuring the checkout process is quite straightforward:
Assuming you become adept at using the continuous improvement process [Hack #2], you should be making small but important incremental improvements in your checkout process before long. Brett Hurt and Eric T. Peterson |
EAN: 2147483647
Pages: 157