Monitoring and Recording Performance
| To gather statistical information on how a server is performing requires, you need to use operating system tools to gather a broad scope of information. System Monitor and Event Viewer are two operating system tools you can use to gather hardware information and information pertaining to the interaction between SQL Server and the operating system. At the database engine and database level, you use the SQL Profiler by itself and in combination with other SQL Serverspecific tools. As you begin to do a more granular inspection, you need to use the Database EngineTuning Advisor (DTA). You can use a number of specialized techniques for gathering more specific information about the server and its processes. To better understand this information and provide an organized technique for gathering the information, we will begin with current informationinformation about what is happening on the server nowand progress through the monitoring tools for more granular data. Using Activity Monitor for the Here and NowActivity Monitor enables you to determine, at a glance, the volume and general types of activity on the system that are related to current blocked and blocking transactions in the system, connected users, the last statement executed, and locks that are currently in effect. This tool should be familiar to those who have used the Current Activity tool in previous versions of SQL Server. Activity Monitor provides a display of process information; locks, broken down by process identification; and locks, broken down by object. The process information in Activity Monitor provides information on all activity currently executing against the system. It also lists current connections that may not be active but are still using resources. Activity Monitor has the following process information columns:
Activity Monitor is a good source for determining the current situations in the server. Filter settings are available to focus the display on a particular area of processing. With the filters set, you can view a specific application, database, user, or other element by simply providing the details to the filter. A limitation of the Activity Monitor is that it provides a current snapshot of the activity on the server and does not record information for future analysis. Activity Monitor allows you to apply filters to the information shown. By using filters, you can isolate a single application, user, database, or type of process desired. Using filters can make problems easier to find and can identify processes that are being affected by locks and blocking. You can user filters to show processes that are being blocked, doing the blocking, or a combination. Exam Alert You use the BlockedAndBlocking filter from the Blocking Type drop-down to assist in finding deadlocks showing processes that are blocking others as well as being blocked themselves. You use the BlockedOrBlocking setting to assist in finding all processes being affected by a lock or set of locks showing any process on either side of the blocking equation. One of the best uses for the information you obtain from Activity Monitor is to provide a quick determination of the status of locking within the system. This can help isolate problems with processes that interfere with updates, such as locking, blocking, and deadlocks. For ongoing and historical problem analysis, however, this information provides little value, and you need to perform a deeper analysis by using the SQL Server Profiler. Management Studio: Log File ViewerSQL Server stores a significant amount of information for future reference. You can find historical events occurring within the database engine and other events that affect the performance of the engine. One set of logs is maintained by the operating system for all applications, and the second is specific to SQL Server. In addition, SQL Server stores a lot of metadata-style information in its own system tables. In SQL Server 2005, log information is centrally accessible from within Management Studio. The Log File Viewer is a tool that allows you to view the contents of SQL and Windows logs within a single interface. You can even select multiple logs to provide a view that overlays the information from more than one source, as illustrated in Figure 7.1. Figure 7.1. Overlaying information from multiple logs.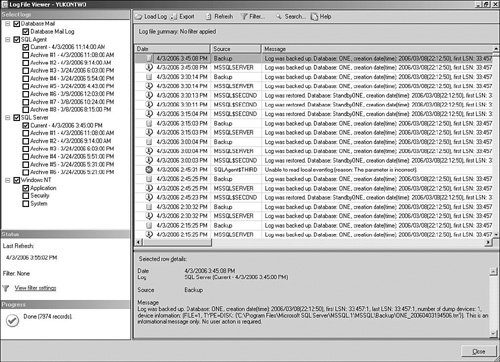 You can find data from Windows Event Viewer in the SQL Server Log Viewer, under the Windows NT tree. There are three primary logs within the viewer: the Application log, Security log, and System log. The Application log maintains the information that is most pertinent to SQL Server. Events recorded in these logs, with the sources MSSQLSERVER, MSSQL$InstanceName, SQLSERVERAGENT, and SQLAgent$InstanceName. Windows NT LogsThe information you see in the Log File Viewer is limited to what SQL Server shows for the view and does not provide all the information sometimes needed to resolve the problem. There is usually sufficient information in the error message itself. In some cases, you will find more information about a particular error on the Microsoft website. In that case, it is helpful to open the Application Log from the Windows menu instead of from within Management Studio. To access further information about the error message online, you open the Application log from the Event Viewer within the Administrative Tools from the Control Panel. To view information for any particular event, you simply double-click the event or right-click the event and select properties from the context menu that appears. You can select the hyperlink to navigate to the Microsoft website, where you find the applicable error information. This link is not provided from within the SQL Server Log File Viewer. From the Windows NT event logs, you can quickly spot problems and diagnose the steps that led up to any given situation. The Event Viewer and the Log File Viewer both have options available for you to filter events to specific categories and severity. You can also select other computers to view to find additional information about an event. SQL Server LogsSQL Server maintains other logs that contain information about the database engine, SQL Server Agent, and Database Mail. The server maintains a set of logs. The Current log contains the events that have occurred since the service was started. Every time you reboot the server or restart the service associated with the log, the logs are advanced. A considerable amount of information is maintained in the logs. When the logs are cycled, the oldest log is removed, and each archive moves down a position, with the Current log becoming the first archive. In many environments, the log information is periodically exported and permanently stored so that no entries are permanently lost. These log files are physically stored within the file system. By default, the error log is located at Program Files\Microsoft SQL Server\MSSQL.n\MSSQL\LOG\ERRORLOG and ERRORLOG.n files, where n is a sequential number. You can use the sp_cycle_errorlog stored procedure to force the error logs to cycle. This may be desired if the server has been running for a long time without a restart. The procedure cycles the error log files without having to restart the instance of SQL Server. Exam Alert By default, SQL Server retains the previous six logs in the C:\Program Files\Microsoft SQL Server\MSSQL.n\MSSQL\LOG\ folder. The most recent log has the extension .1, the second .2, and so on. The current error log has no extension. The SQL Server Agent log is stored in C:\Program Files\Microsoft SQL Server\90\mssql90\Log\ as Sqlagent.out. Both SQL Server logs and the Windows NT application log are useful in helping to identify problems and their causes. Of course, the information in these logs is historical in nature but can help isolate errors. Server-Maintained InformationSQL Server stores in its many system tables metadata pertaining to objects maintained by the server. Metadata is information about the properties of data, such as the type of data in a column (numeric, text, and so on) or the length of a column. It can also be information about the structure of data or information that specifies the design of objects, such as cubes or dimensions. You can view metadata via direct query from the system tables or through a number of views, functions, and stored procedures. It is recommended that you not query system tables directly but instead use associated views and procedures to gain the necessary information from these tables. Dynamic Management Functions and ViewsDynamic management views and functions return server state information. You can use this information to monitor the server. These views and functions can assist in diagnosing problems and can provide information that may assist in performance tuning. They also return implementation-specific state information. The structure the views use to return data may change in future releases of SQL Server. Therefore, dynamic management views and functions may not be compatible with future versions of SQL Server and are not recommended for system process design use. Exam Alert Dynamic management functions and views can be quite useful but are limited for the SQL Server version in which they are associated. You cannot use these functions and views for any process that must remain compatible from version to version. All dynamic management views and functions exist in the sys schema. All of these objects follow the naming convention dm_*. When you use a dynamic management view or function, you must prefix the name of the view or function by using sys. All view and function names should therefore be similar to sys.dm_*. Database Console Command (DBCC)One of the most useful diagnostic/tuning tools available to SQL Server database developers and administrators is the DBCC command. Today, DBCC stands for database console command. In previous versions of SQL Server, it stood for Database Consistency Checker. DBCC allows you to diagnose and repair some common situations on a server. You can use DBCC statements to check performance statistics and the logical and physical consistency of a database system. Many DBCC statements can fix detected problems. For this reason, DBCC is revisited in Chapter 8. Some DBCC operations provide useful information about the processes that have been performed most recently on the server. This type of information can be useful in pinpointing the source of SQL activities. Each of the options provides a small piece of a large puzzle, but collectively they can provide a useful picture of the current server activity. The following are some of the most commonly used DBCC options:
Many other DBCC options are available. To gain a complete understanding of everything DBCC can do, you need to work with it on a regular basis. Exam Alert Expect to see DBCC options as potential answers for many of the 70-431 exam question scenarios. Useful in gathering information as well as troubleshooting, repairing, and optimizing, DBCC is a commonly used tool for database administrators. Although DBCC represents one of the most frequently used Microsoft tools available to SQL Server administrators, there are other alternatives for troubleshooting. For example, trace flags have long been used as debugging tools. However, with other graphic tools now available that are easier to use and decipher, the use of trace flags is decreasing. Microsoft has stated that behaviors available with these flags may not be supported in future releases of SQL Server. However, because trace flags are still used today and may appear on the 70-431 exam, the following section discusses them. Trace FlagsTrace flags display information about specific activities within a server and are used to diagnose problems or performance issues. They are particularly useful in deadlock analysis. Trace flags temporarily set specific server characteristics or switch off particular behaviors. Trace flags are often used to diagnose and debug stored procedures and analyze complex system elements. Four trace flags are commonly used for troubleshooting different elements of SQL Server:
SQL Server provides many flags to aid in server troubleshooting. The administrator is responsible for specific aspects of the use of the flags and should not put them in place without understanding the repercussions. Simple Network Management Protocol (SNMP)SNMP is an industry-standard protocol for monitoring computer systems and other related hardware. An SNMP Manager can query devices throughout the environment. It is possible to query a SQL server that has SNMP installed and enabled to obtain statistical and state information about the server. By using SNMP, you can monitor SQL Server across different platforms (for example, UNIX and different versions of Microsoft Windows). You can use SNMP applications available from a number of vendors to monitor the status and performance of instances of SQL Server, explore defined databases, and view server and database configuration parameters. |
EAN: 2147483647
Pages: 200