Experiments on Simulated and Real-Life Data Sets
|
| < Day Day Up > |
|
In this section we present the results of our experiments on three data sets. The first is a simulated data set, which incorporates a number of distribution assumptions. The others are real-life heart disease and liver disorders data sets.
Simulated Data
Our experiments are based on data previously used for comparing a number of statistical and linear programming techniques for discrimination. Joachimsthaler and Stam (1988) examined Fisher's linear discriminant function, the quadratic discriminant function, the logistic discriminant function, and a linear programming approach under varying group distribution characteristics. Koehler and Erenguc (1990) and Abad and Banks (1993) used the same data generator to establish identical experimental conditions to evaluate a number of other linear programming approaches. Koehler (1991) used this data to determine the effectiveness of a genetic search approach for discrimination. Recently, Bhattacharyya and Pendharkar (1998) used this data set to evaluate various induction, evolutionary and neural techniques for discrimination problem.
We use four simulated data sets for our research. The data varies with respect to the type of distribution, determined through the kurtosis. Four kurtosis values of -1, 0, 1, and 3 correspond approximately to samples drawn from uniform, normal, logistic and Laplace population distributions. Each data set consists of 20 data samples. Each sample has three attributes and has 100 observations equally split between two groups. In order to minimize the effect of group overlap, the group means are set as follows: the group 1 mean is =(0,0,0) throughout, and the group 2 mean was=(.5, .5, .5). The dispersions of the two groups were the kept same. A more detailed description of the data can be found in Joachimsthaler and Stam (1988). We use 40 data samples (10 from each of the 4 kurtosis values) for training and remaining 40 data samples for testing (holdout set). The cost preferences, based on the assumed cost matrix shown in Figure 1, are PTypeI = 0.66 and PTypeII = 0.33, respectively. Figures 2 through 5 illustrate the results of our experiments.
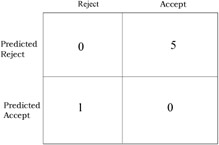
Figure 1: The misclassification cost matrix
Figures 2 through 5 show that ICPB-GA minimizes Type I errors at the expense of total correct classification. In otherwords, when ICPB-GA minimizes Type I errors, Type II errors increase and overall correct classification goes down. Table 1 provides tests of difference in means for total classification and Type I error for the three techniques.
| Type | Hypothesis | Mean (%) | Mean (%) | t-value | P>t |
|---|---|---|---|---|---|
| Training Sample | |||||
| Correct Classification | μGA =μLDA | μGA =74.2 | μLDA = 68.9 | 18.56 | 0.000 [a] |
| μLDA =μICPB-GA | μICPB- GA=69.4 | μLDA = 68.9 | 0.63 | 0.266 | |
| μGA =μICPB-GA | μGA =74.2 | ICPB- GA=69.4 | 7.62 | 0.000[a] | |
| Type I Error | μGA =μLDA | μGA =14.17 | μLDA = 15.32 | 1.52 | 0.0680 |
| μLDA =μICPB-GA | μICPB- GA=5.2 | μLDA = 15.32 | 18.92 | 0.000[a] | |
| μGA =μICPB-GA | μGA =14.17 | μICPB- GA=5.2 | 1088 | 0.000[a] | |
| Holdout Sample | |||||
| Correct Classification | μGA =μLDA | μGA =63.6 | μLDA = 64.6 | -1.16 | 0.126 |
| μLDA =μICPB-GA | μICPB- GA=61.1 | μLDA = 64.6 | -3.205 | 0.001[a] | |
| μGA =μICPB-GA | μGA =63.6 | μICPB- GA=61.1 | 1.85 | 0.071 | |
| Type I Error | μGA =μLDA | μGA =18.5 | μLDA = 17.52 | -1.13 | 0.132 |
| μDA =μICPB-GA | μICPB- GA=6.9 | μLDA = 17.52 | 1664 | 0.000[a] | |
| μGA =ICPB-GA | μGA =18.5 | μICPB- GA=6.9 | 10.50 | 0.000[a] | |
|
[a]significant at level of significance= 0.01 | |||||
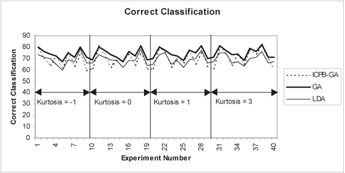
Figure 2: Results for correct classification in the training sample for simulated data
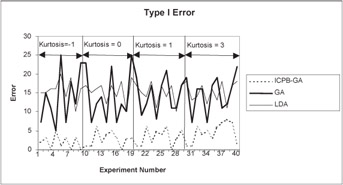
Figure 3: Type I error in the training sample for simulated data
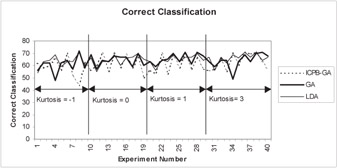
Figure 4: Results for correct classification in the holdout sample for simulated data
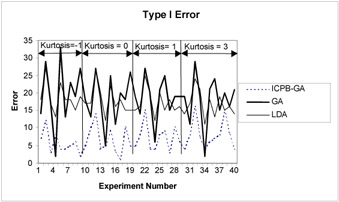
Figure 5: Type I error in holdout sample for simulated data
The results in Table 1 support the observation that ICPB-GA lowers Type I error at the expense of lowering overall correct classification. For Type I error, the difference of means between ICPB-GA and both GA and LDA is significant in both the training and holdout samples. For correct classification, the difference of means between ICPB-GA and GA is significant in the training sample but not significant in the holdout sample. The test statistic for difference of means between ICPB-GA and LDA for correct classification is not significant in the training sample but is significant in the holdout sample.
Heart Disease Data
We apply the three classification techniques on real-life data that has been used in previous studies (King, Henry, Feng & Sutherland, 1994). The data set comes from the Cleveland Clinic Foundation and is now a part of the collection of machine learning databases at the University of California, Irvine. We use the three approaches (LDA, GA, ICPB-GA) for predicting heart disease. The data set consists of 270 total examples with two groups, presence and absence of heart disease. The group covariances are equal. The kurtosis value for the data was 3.6.
There are 13 attributes with eight attributes being numerical continuous variables and 5 having categorical values. The data set also has a misclassification cost matrix, which was supplied by doctors in Leeds, Great Britain. The misclassification cost matrix is shown in Figure 6. We took the original data set of 270 examples and divided it into two sets. The training data contained 160 examples and the holdout data set contained 80 examples. Only 240 examples out of a total of 270 were used so that both training and test data sets contain 50% examples belonging to class1 (presence of heart disease) and other 50% belonging to class 2 (absence of heart disease).
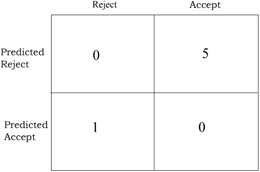
Figure 6: The misclassification cost matrix for heart disease data set
Table 2 presents the results of our experiments on the heart disease data set. As expected, ICPB-GA lowered the Type I error when compared to LDA and GA in both the training and holdout samples. When the number of correct classifications was considered as the performance metric, LDA performed better than GA and ICPB-GA in the training sample, and GA performed better than LDA and ICPB-GA in the holdout sample. When we consider the misclassification cost as a performance metric, ICPB-GA provides the lowest misclassification cost. The misclassification cost is defined as follows,
| Type | LDA | GA | ICPB-GA |
|---|---|---|---|
| Training Sample | |||
| Correct Classification (%) | 85.0 | 82.5 | 70.6 |
| Type I Error (%) | 6.3 | 7.5 | 1.8 |
| Misclassification Cost | 10.62 | 12.62 | 9.79 |
| Holdout Sample | |||
| Correct Classification (%) | 83.7 | 86.3 | 75 |
| Type I Error (%) | 7.5 | 7.5 | 1.3 |
| Misclassification Cost | 6.14 | 5.81 | 3.98 |
Misclassification Cost = Cost of Type I Error * (Total Type I Errors) + Cost of Type II Error * (Total Type II Errors)
BUPA Liver Disorders Data
The BUPA liver disorders data set was created by BUPA Medical Research Limited. The data set was donated by Richard Forsyth and is available as a part of the UC Irvine Machine Learning Databases. There are 6 usable attributes in the data set. We use 5 of these attributes as predictor variables (results of the blood test) and one attribute as a class variable. The class variable is the number of alcoholic drinks, which is 0 if number of drinks is less than 3 and 1 otherwise. This data has been previously used by Turney (1995). The original data set contains 345 cases with no missing values. We divided the data randomly into 173 training cases and 172 test cases. Table 3 provides the results of our experiments on comparing the three techniques.
| Training Sample | Holdout Sample | |||
|---|---|---|---|---|
| Type | Correct Classification | Type I Error | Correct Classification | Type I Error |
| LDA | 75.1 | 9.2 | 60.5 | 18.0 |
| GA | 73.9 | 9.2 | 56.9 | 22.6 |
| ICPB-GA | 72.2 | 1.1 | 59.9 | 6.9 |
The results of the liver disease data set are consistent with those of simulated and heart disease data. The cost-based approach (ICPB-GA) performed better than the non-cost-based approaches if Type I error is the performance metric. LDA performed best if correct classification is used as the performance metric.
The results of our experiments on simulated and real-life data sets illustrate the benefits of incorporating cost-based preferences with GA classification systems. Thus, in classification problems in which decision makers trade off between misclassification costs, an integrated cost based preference classification approach such as ICPB-GA may be a promising approach when compared to traditional LDA or GA.
|
| < Day Day Up > |
|
EAN: 2147483647
Pages: 174