Understand Image Maps
|
What exactly is an image map? It is a single image or graphic that has had portions mapped out and identified in your XHTML code. The mapped portions, sometimes known as hot spots, are linked to other Web pages. When visitors to your site click on different parts of the graphic, they are taken to different places depending on where they clicked. With careful planning, an image map can add a professional look to your Web site.
Understand Image-Mapping Terms
Creating an image map is not difficult, although it can become complex depending on how you design it. A good starting point for learning to create image maps is to become familiar with some of the basic terminology. As you work with image maps, keep these key terms in mind:
-
Server-side image maps The original method for creating image maps, server-side image maps reside and operate on your Web host. You create the map, but the Web server actually processes it. This kind of image map is somewhat complicated to create. Also, because the work is done on the server, it can be slower to respond. The W3C recommends that you use client-side image maps instead.
-
Client-side image maps A client-side image map resides and operates on your visitor’s computer. You write the code for the map and include it in the XHTML for your page. Client-side image maps are faster, reduce the load on the server, and are easier to create. This chapter focuses on creating client-side image maps.
-
Hot spots A hot spot is a portion of an image that has been mapped and linked to another page. When visitors click on a hot spot, they are taken to the new page.
-
Coordinates You use coordinates to map out the portions of your image that you want to turn into hot spots. The coordinates are simply numbers that are associated with the pixels used to create the image. Coordinates always begin at 0,0 at the upper-left corner of an image and increase in number toward the lower-right corner. (The horizontal coordinate comes first; vertical comes second.)
-
Shapes You can map coordinates in three basic shapes: circles, rectangles, and polygons. Circles and rectangles are self-explanatory. Polygons include complex shapes that won’t fit into the preceding definitions.
Understand Image Map Elements
As you might expect, there are special XHTML elements for both server-side and client-side image maps. By becoming familiar with each of these elements, you can demystify the process of creating your own image map. The image map elements are as follows:
-
<map> </map> Defines a client-side image map on your Web page.
-
<area /> Used for specifying the coordinates of hot spots in client-side image maps. You use one <area /> element for each hot spot on the image. Note that <area /> is an empty element.
-
<img /> Used element to specify the image you want to use for your image map.
Understand Image Map Attributes
A number of different attributes come into play when you construct an image map. These do everything from assigning a special name for your map to laying out the coordinates for your hot spots. The image map attributes are as follows:
-
ismap This attribute is used with server-side image maps. Even though this chapter does not discuss how to create server-side maps, as you will see later, the ismap attribute can prove useful in helping you identify the coordinates for your hotspots.
If you're having trouble with the concept of coordinates, think of the game Battleship. There is a grid mapped out into squares with numbers along the vertical axis and letters along the horizontal axis. To fire at an opponent, you name a coordinate. For example, A-5 would be the first line, five squares from the left. Image coordinates work the same way, except that you use numbers for both horizontal and vertical. Coordinates of 47, 22 represent a position on an image that is 47 pixels across from the upper-left corner and 22 pixels down from the top.
-
shape The shape attribute is used with <area /> and can take values of circle, rect (rectangle), and poly (polygon, the default). You use it to define the shape of your hot spots.
-
coords The coordinates attribute is used within the <area /> element to plot the coordinates for your hot spots. The values are the pixel numbers of the coordinates, separated by commas. Circles, rectangles, and polygons all are plotted differently, as will be demonstrated later in the chapter in “Plot Coordinates.”
-
name The name attribute works in the <map> element to assign a name by which browsers will recognize your map. You can choose whatever name you wish for your map. An easy-to-remember, descriptive term is usually the best choice. For example, for this chapter you will be working with a map named practicemap.
Note Because the name attribute has been deprecated in XHTML 1.0 and totally removed in XHTML 1.1, the W3C recommends that you use the id attribute instead of name.
-
usemap The usemap attribute is placed within the <img /> element and tells the browser which map to look for when applying the coordinates. The proper way to identify the map is with the name (or id) you created for it, preceded by a pound sign (#). For example, if you were telling a browser to use the practicemap mentioned earlier, you would write usemap="#practicemap".
Any time you hear the term client in Web design, it means the computer of the person who is visiting your site. The term server refers to the Web server that hosts your site. When an application (such as an image map or a script) is referred to as server-side, it is operating on your Web host's computer. A client-side application is downloaded with your Web page and uses the resources of your visitor's computer. Client-side applications tend to operate faster because information does not have to pass between your visitor's computer to the server and back again. Thus, they are generally the better choice for Web authors.
Project 20: Create a Client-Side Image Map
If you want to use a client-side image map on your page, you must either use image-mapping software or map the coordinates yourself. There are quite a few different programs available that create image maps for you and take care of writing all the necessary HTML code. These generally are inexpensive ($30–$50) and will speed up the process considerably. If you plan to do a lot of Web design and will be creating image maps frequently, undoubtedly these are the way to go. However, if you are doing only a few image maps and time isn’t a problem, you might enjoy the process of creating them on your own.
Choose an Image
Because image maps are used for navigation, it’s important to choose or create your image with that in mind. For some reason, image maps seem to bring out the artistic side of Web authors. Although that is not a problem in itself, it can become one. If you are so artsy with your image map that visitors can’t figure out your navigation scheme, you’ve defeated your purpose.
| Tip | Choose your images carefully. Don’t select a beautiful landscape for your image map just because you think it’s attractive. If you are going to depend on images for navigation, they should be reasonably self-explanatory. |
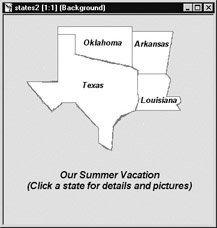
Yet it’s not uncommon to find many sites whose authors have decided to use image-based navigation alone, allowing the visitors to figure out the system on their own. You can avoid this by choosing or creating an image that provides a self-explanatory means of navigation. For example, say you took a wonderful summer trip through four southern states—Texas, Oklahoma, Arkansas, and Louisiana—and you want to put together a Web site that displays stories and pictures from each state you visited. You could create a simple map of the four states and make each state a separate hot spot on your image map, as in the following illustration:
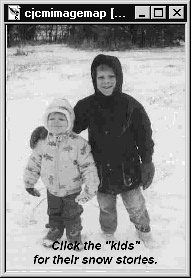
You can just as easily use a photograph for your image map. However, because a photo is not self-explanatory, you might want to use an image editor to add some directions for your visitors, as shown here:
| Tip | You can use any image format that will work on a Web page. Your primary choices are GIF, JPEG, and PNG images. |
Find the Coordinates
The most time-consuming process of doing image maps is determining the coordinates for your hotspots. Depending on how refined you want the hot spot to be, you can find yourself sorting through a lot of numbers—the trick is keeping them straight. Of course, the other challenge is figuring out the coordinates in the first place.
Determine Coordinates with ISMAP
If you know the size of your image and don’t care too much about accuracy, you can always determine the coordinates for your hot spots by estimating them. As a rule, though, you are going to want to be a little more precise when creating an image map. Thus you need to have some way to determine the exact coordinates of different spots on your image. The most common way of doing this is with an image-editing program (see Chapter 6 for a list of available software) or with image-mapping software. However, if you don’t want to invest in either of these, there is a way to determine pixel coordinates by using your Web browser and the ismap attribute.
Ismap is used with server-side image maps, but it can also be used to tell your browser to display an image’s coordinates on the status bar at the bottom of the screen. To do this you merely need to create an HTML page using the image you want to plot as a link. It’s not necessary for the link to actually point to a real Web page. Include the ismap attribute to fool the browser into thinking the image is linked to a server-side image map. The browser will display the image’s coordinates on the status bar.
Ismap should be included in the <img /> element, enclosed in a practice “link,” as follows:
<a href="nolink.htm"> <img alt="Coordinate shortcut" src="/books/4/238/1/html/2/practicemap.gif" ismap="ismap" /> </a>
| Note | The practice link does not really need to link to anything. It just needs to be there. |
To see this work, try typing in the following code and saving it as coordinatemap.htm. You can include any image file in the src="/books/4/238/1/html/2/ " attribute. The image file used for the following illustration is practicemap.gif, which can be downloaded from the author’s Web site at www.jamespence.com.
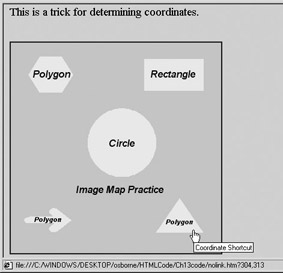
When you have saved your page and displayed it in your browser, move your mouse cursor over the image. You should see a set of numbers in the status bar at the bottom of the page. Those numbers should change whenever you move the mouse over the image; they should disappear entirely if you move the cursor off the image. Notice in the following illustration that the status bar lists the coordinates where the cursor is pointing as 304, 313. That means the cursor is placed at a point that is 304 pixels from the left and 313 pixels down from the top.
<html> <head> <title>Determining Coordinates with ISMAP</title> </head> <body> <p style="font-size: 14pt; text-align: left;">This is a trick for determining coordinates.</p><br /> <p><a href="nolink.htm" ismap="ismap"> <img alt="Coordinate Shortcut" src="/books/4/238/1/html/2/practicemap.gif" /> </a></p> </body> </html>
Determine Coordinates with Image Editing Software
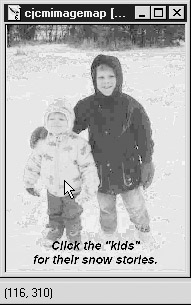
Another way to determine pixel coordinates is with an image editor such as PaintShop Pro. All you have to do is open the image in the program, move the mouse over the image, and you will see the pixel coordinates displayed at the bottom of the screen. As with the preceding illustration, whenever you move the cursor, the coordinate numbers change. The following illustration shows what you should see when using an image editor:
Plot Coordinates
When you have a way of finding coordinates, the next step is to plot them. Plotting coordinates is simply a matter of deciding on the key portions of your image that you want to turn into hot spots. Then you determine their coordinates and write them down in a way that a Web browser can understand them. You plot coordinates differently, depending on the kind of shape you are trying to map. With a rectangle you always go from upper-left to lower-right. For a circle you begin at the center. If you are mapping a complex shape, such as a polygon, you proceed in a clockwise direction, beginning from the upper left.
Plot a Rectangle
The simplest shape to plot is a rectangle. You only need to find two sets of coordinates: the upper-left corner and the lower-right corner. Find these by putting the mouse cursor over the upper-left corner and noting the two numbers. For example, in Figure 13-1 (practicemap.gif) the coordinates for the upper-left corner of the rectangle are 221, 27. The coordinates for the lower-right corner are 320, 79.
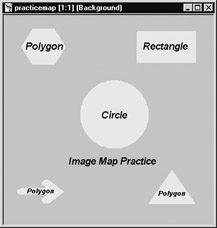
Figure 13-1: Practice Image Map
| Tip | If you are using an image editor, you will find it much easier to be exact if you enlarge the image several times. The pixel count won’t change and you’ll greatly increase your accuracy with complex images. |
To plot this rectangle and turn it into a hot spot, you would write a line of code using the <area /> element along with the shape, coords, and href attributes, like this:
<area shape="rect" coords="221, 27, 320, 79" href="rectangle.htm" />
The shape attribute tells the browser what kind of shape to look for. The coords attribute gives the location of the shape. Finally, the href attribute provides the link that makes the shape a hot spot. Be sure to separate your coordinates by commas.
| Tip | It is not necessary to use parentheses or brackets to combine the pairs of coordinates; the browser automatically takes them in pairs. However, you might find it easier to follow your own code if you add an extra space between pairs of coordinates. The browser ignores the white space, and you’ll find it easier if you ever have to go back in and edit your code. |
Plot a Circle
Plotting a circle is a little different from plotting a rectangle. Instead of going to the upper-left corner of the circle (a difficult proposition, as there is no corner), you start by estimating the circle’s center. You don’t need to be perfectly precise here. Just get as close as you can. Again, you might find it easier to enlarge the image to help you make a better estimate. When you’ve eyeballed the center of the circle, note the coordinates. The next number you give will not be a pair of coordinates, but rather the radius of the circle.
To find the radius of the circle:
-
Place the cursor on the left side of the circle, as near the middle as possible and note the horizontal (first) coordinate.
-
Move the cursor to the right side. Watch the coordinates to make sure the vertical (second) coordinate does not change.
-
Note the second horizontal coordinate.
-
Subtract the smaller number from the larger.
-
Divide the result in half, and you will have the radius.
After you have determined the center coordinates and the radius, plot your circle like this (the first two numbers are the center; the third is the radius):
<area shape="circle" coords"184, 164, 57" href="circle.htm" />
The coordinates in the preceding line are taken from the circle in the practicemap.htm image displayed in Figure 13-1. If you download this file from the author’s site (www.jamespence.com), you will be able to practice along with the text in this chapter.
Plot Polygons
A polygon is any shape that requires multiple corners, angles, and points of reference. For example, a polygon could be something as obvious as the triangle or hexagon in Figure 13-1. It would also be the arrow in the same figure, the shapes of the four states in the vacation image, and even the outlines of the two children in the photo image map. All of these various shapes would be plotted as polygons, which is why it is the default value for the <area /> element.
To plot a polygon, use the upper-left corner as your starting point. If the image doesn’t have a corner as such, choose the uppermost left point. Note the coordinates for that point and move clockwise to the next angle or corner. Also note those coordinates and proceed to the next angle until you have moved around the outside of the image and back to your starting point.
Plot a Triangle
To plot the triangle in Figure 13-1, begin at the top corner and note the coordinates: 281, 259. The coordinates for the bottom-right corner are 320, 316, and those on the bottom left are 242, 316. Now, apply those coordinates into the <area /> element like this:
<area shape="poly" coords="281,259, 320,316, 242,316," href="triangle.htm" />
Plot a Hexagon
The hexagon in the upper-left portion of Figure 13-1 presents a slightly more complex shape to plot. If you simply remember to start at the uppermost left corner and move clockwise from angle to angle, you’ll find that it’s not much more difficult.
For the hexagon, beginning at the upper-left corner, the coordinates are displayed in this illustration:
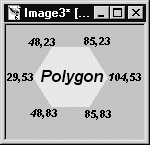
To turn the hexagon into a hot spot, take the preceding coordinates and list them in order, moving clockwise, as in the following line of code:
<area shape="poly" coords="48,23, 85,23, 104,53, 85,83, 48,83, 29,53," href="hexagon.htm" />
Plot an Arrow Shape
The only shape yet to be plotted on practicemap.gif is the arrow in the bottom-left of the picture. Even though this is the most complicated shape you’ve had to deal with in this chapter, by now you should find it very easy. Begin at the upper-left corner of the arrow and plot each angle in a clockwise direction. Just as you did with the other shapes, include them in the <area /> element. The coordinates in this code come reasonably close to defining the rounded edges of the arrow. Be careful not to omit any commas, or it could throw your entire scheme off.
<area shape="poly" coords="70,275, 101,295, 74,315, 67,314, 72,300, 26,300, 22,294, 32,288, 70,288, 65,283" href="arrow.htm" />
| Note | It is not necessary for your coordinates to be precise unless you want the clickable area to coincide exactly with the shape on the screen. The general principle is this: The more precisely you want the shape defined, the more coordinates you need. Generally, though, you’ll do fine with fewer measurements. |
Complete the Image Map
Now that you have plotted the coordinates for practicemap.gif, all you need to do to finish your image map is write the rest of the code for your page. Open template.htm and save it as imagemap.htm. Then follow these steps to turn practicemap.gif into a functioning image map:
-
In the <body> section of the page, insert the <map> element.
<body> <map> </map> </body>
-
Modify the opening <map> tag by adding the name=" " attribute, with practicemap as the value.
<body> <map name="practicemap"> </map> </body>
Note If you want to use the XHTML Strict DTD, or write XHTML 1.1, then you need to substitute the id attribute for name.
-
Add the area elements you have already written. There should be one <area /> element for each shape you have defined, and they all should be nested inside the <map> </map> element.
<body> <map name="practicemap"> <area shape="rect" coords="221, 27, 320, 79" < href="rectangle.htm" /> <area shape="circle" coords="184, 164, 57" href="circle.htm" /> <area shape="poly" coords="281,259, 320,316, 242,316," href="triangle.htm" /> <area shape="poly" coords="48,23, 85,23, 104,53, 85,83, 47,83, 29,53," href="hexagon.htm" /> <area shape="poly" coords="70,275, 101,295, 74,315, 67,314, 72,300, 26,300, 22,294, 32,288, 70,288, 65,283" href="arrow.htm" /> </map> </body>
-
Add the <img /> element to insert your map on the page. You also will insert the usemap=" " attribute with the name #practicemap so the browser will know the image is an image map.
<body> <map name="practicemap"> <area shape="rect" coords="221, 27, 320, 79" < href="rectangle.htm" /> <area shape="circle" coords="184, 164, 57" href="circle.htm" /> <area shape="poly" coords="281,259, 320,316, 242,316," href="triangle.htm" /> <area shape="poly" coords="48,23, 85,23, 104,53, 85,83, 47,83, 29,53," href="hexagon.htm" /> <area shape="poly" coords="70,275, 101,295, 74,315, 67,314, 72,300, 26,300, 22,294, 32,288, 70,288, 65,283" href="arrow.htm" /> </map> <img src="/books/4/238/1/html/2/practicemap.gif" alt="Practice Image Map" usemap="#practicemap" /> </body>
Tip To see how the image map really works, create five HTML pages and name them rectangle.htm, circle.htm, triangle.htm, hexagon.htm, and arrow.htm. Save them in the same directory as your imagemap.htm file. That way your links will actually take you somewhere.
Now load imagemap.htm into your Web browser and move your mouse over each of the images. You’ll notice that the status bar at the bottom of the browser window changes as the cursor goes over each different shape. If you click on each shape, it should take you to the page you created for that part of the image map.
|
EAN: 2147483647
Pages: 126