Performance Monitor: Viewing Performance Information
Performance Monitor ( PerfMon ) is an operating system application built into Windows NT 4.0 and upward. On Windows XP and .NET Server, it's called System Monitor. It allows you to monitor and graph both predefined and customized performance information about your .NET applications. Although PerfMon doesn't aim to show you exactly how your application performs from a high-level point of view, it does give you detailed information about what's happening inside your application that you can use to diagnose performance and resource problems.
PerfMon is actually a combination of four separate utilities. Each utility is a different view of selected counters that measure the performance of the hardware and software on a particular computer.
-
Alert shows a list of counters to monitor and a log of counters that have exceeded a specified limit.
-
Chart displays selected performance data on a chart in real time.
-
Log shows a list of counters that are logging data to a file, for monitoring over an extended period.
-
Report displays the current values of the selected counters.
You can create and customize your own performance data programmatically, a technique that I examine in the next chapter during an investigation of instrumentation and tracing. In this section, I'm going to look at some of the information automatically provided for you to monitor the performance of your . NET applications. This information provides statistics and performance data about the following categories:
-
Exceptions
-
COM Interop
-
The JIT compiler
-
Application loading
-
Locking and threading
-
Memory
-
Networking
-
Remoting
-
Security
Copious information about the performance counters within each of these categories is available in the .NET documentation. Rather than just rehash this documentation, I thought it would be better to write and then monitor a small program so that you can see why the Performance Monitor is so useful.
Testing String Performance
To put together a comparison of repeatedly modifying a string versus using the StringBuilder class, I wrote a program to perform each of these tasks and then used PerfMon to monitor the internal behavior of these two programs. Listing 5-4 shows the code for repeatedly modifying a string, in this case 20,000 times.
| |
Option Strict On Module StringPerfTestOne Sub Main() Dim strTest As String = "Coming up: ", intTest As Integer = 0 System.Console.WriteLine("Starting...") For intTest = 1 To 20000 strTest += "another test " Next System.Console.WriteLine("Finished") System.Console.ReadLine() End Sub End Module | |
Listing 5-5 shows the same code, but now using the StringBuilder class. The documentation is adamant that the StringBuilder class is a huge improvement over VB.Classic's string handling, so now I'm going to look at what actually happens internally.
| |
Option Strict On Module StringPerfTestTwo Sub Main() Dim sbTest As New System.Text.StringBuilder("Coming up: ") Dim intTest As Integer = 0 System.Console.WriteLine("Starting...") For intTest = 1 To 20000 sbTest.Append("another test ") Next System.Console.WriteLine("Finished") System.Console.ReadLine() End Sub End Module | |
Comparing the execution of these two programs should give you some idea about the relative performance of these ways of manipulating strings. The crude way of measuring this is simply to time the two samples. If you do this, you'll find that using the StringBuilder class is much faster than modifying the string manually.
But I want to investigate further and find out what's happening underneath the hood. There's a performance counter supplied by .NET that monitors the percentage of time a process spends in the .NET garbage collector (GC). To start the ball rolling, you should run the program shown in Listing 5-4 after adding a breakpoint on the line marked in bold. This breakpoint gives you a chance to switch to PerfMon and set up the monitoring process.
Once you've started the program and hit the breakpoint, you should start PerfMon by typing PerfMon at the Start ’ Run command. Go to the System Monitor page and add a new performance counter by clicking the Add toolbar button, which is the one marked with a plus sign (+). Under the "Performance Object" heading, choose ".NET CLR Memory" and under the "Select counters from list" heading, select the "% Time in GC" counter. Then select the String-PerfTestOne process as the one to monitor.
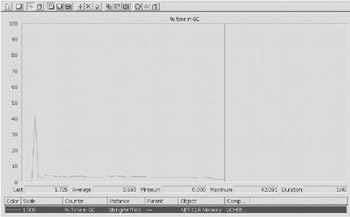
Now switch back to the program being monitored and continue from the breakpoint. You should see a graph being drawn in Performance Monitor that shows you the percentage of time that the StringPerfTestOne process is spending doing garbage collection. This should look something like the graph shown in Figure 5-3.

Figure 5-3: Garbage collection for the StringPerfTestOne process
As you can see, the program spends most of its time in the control of the garbage collector! The percentage of time used by the GC on my machine peaks at over 40% percent before dropping back to around 5% as the program runs. The PerfMon profile shown on your machine may differ in quantity from mine, but the overall profile is still likely to resemble a small mountain.
So what happens if you perform the same test, but this time on the application that uses the StringBuilder class? I haven't bothered to include a screenshot of the result, because there's nothing to see. In addition to finishing much faster, the StringBuilder sample program shows a completely flat line in terms of garbage collection.
There are many other .NET performance counters available for investigating your applications, and I urge you to play with a few of them in order to understand how to monitor your programs effectively. VB .NET even comes with a sample program that illustrates how to create your own Performance Monitor. In the next chapter you'll meet PerfMon again when I look at the creation and use of performance counters that are customized for your application.
EAN: 2147483647
Pages: 160