How the Visual Studio Debugger Works
The Visual Studio debugger has some powerful capabilities, but the tradeoff is that it can be more complex to set up and use than the VB.Classic debugger. This section explores how the debugger is able to work its particular brand of magic and aims to give you an understanding of its basic mechanics.
Figure 3-1 is a slightly simplified view of the process that occurs when you press F5 within the VB .NET IDE. The language compiler and Just-In-Time (JIT) compiler together have to turn your lovingly crafted code into instructions that the processor can understand. The debugger then has to reverse this process in order to map back from the processor-native code to the corresponding source code. You should read the diagram in Figure 3-1 going counter-clockwise.
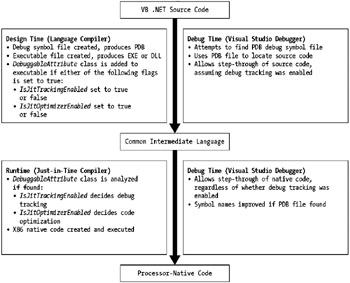
Figure 3-1: How the compilers and the Visual Studio debugger work together
Figure 3-1 shows that compiling your program is now a two-stage process, rather than the single stage offered by the VB.Classic interpreter. Because compiling your application is now a two-stage process, the mapping done by the Visual Studio debugger is more complex.
The first stage is design-time compilation, when the language compiler converts your source code into an intermediate format called Common Intermediate Language (CIL), along with some metadata that describes your program in detail. The CIL and metadata together form the physical executable, which is stored in an .exe or a .dll. This compilation stage also produces debug symbols for each component, in a file with a .pdb suffix. These debug symbol files help the debugger with its code mapping.
The second stage is runtime compilation, when the JIT compiler converts the CIL code to native code that the processor can execute. If you've chosen to enable code optimization, this is when most of the optimization happens. Once the JIT compiler has converted a method, it caches the native code for that method in memory so that the method doesn't have to be compiled again.
It's also important to notice that you're now always executing and debugging a compiled program. This is a change from the VB.Classic IDE, which ran your code using an interpreter rather than a compiler.
Understanding the DebuggableAttribute Class
The DebuggableAttribute class and its two associated flags determine how well you can debug your application. The VB .NET language compiler sets these flags automatically depending on the build settings you specify when compiling your program. The JIT compiler then reads these flags and decides its actions depending on their values. Therefore it's important to know what these two flags represent.
Debug Tracking Flag
If the IsJitTrackingEnabled flag is set to true , the JIT compiler creates tracking information to help the debugger work its way back from the native code to the CIL. This tracking information is a mapping between the native code and the CIL, in the form of what are called offset tables . This mapping is part of the process used by the debugger to show you what's happening in your VB .NET source code during program execution.
Code Optimization Flag
If the IsJitOptimizerDisabled flag is set to true , the native code produced by the JIT compiler is not optimized to run as fast as possible. If it's set to false , the native code produced is optimized to run as fast as possible while still producing the same results. This latter setting can affect debugging because native code optimization can confuse the debugger when it's trying to map from native code back to source code.
What the VB .NET Language Compiler Does
When you press F5 to start running your program from within the Visual Studio IDE, the VB .NET language compiler translates your VB code into CIL. This produces an executable file that has an .exe or .dll suffix and also an associated debug symbol file with a .pdb suffix. This debug symbol file contains information about your program that helps the debugger to match your source code to the corresponding CIL and native code.
The language compiler also decides whether to inject the DebuggableAttribute class into each assembly within your program. If the IsJitTrackingEnabled and IsJitOptimizerDisabled flags contained within this class are both set to false , this signifies a release build where tracking is not needed and code optimization is allowed. In this case, the DebuggableAttribute class is not added to the assembly and in its absence both flags are understood to have the value of false . On the other hand, if either flag is set to true , the DebuggableAttribute class is added to the assembly.
What the JIT Compiler Does
After the program has been compiled, it obviously has to be executed. This is done by the JIT compiler, which translates the CIL for each invoked procedure into processor-native code that the CPU understands. If the DebuggableAttribute class was added to the assembly by the VB .NET compiler, the JIT compiler looks at the two flags discussed previously and uses them to decide whether to add debug tracking information for the debugger and whether to optimize the processor-native code.
What the Visual Studio Debugger Does
Provided that the IsJitTrackingEnabled flag is true , the tracking information that this generates together with the information in the debug symbol file allow the debugger to work backward from the native code through the CIL and into your source code. This means that you can see what your program is doing at the VB .NET source code level even though the code being executed is processor-native code.
Build Configurations and Their Effects on Debugging
How you compile and run each of the projects within your application determines how easily it can be debugged . Both Visual Studio and the command-line compilers have facilities for controlling this process.
Building in Visual Studio
Within Visual Studio, there are two build configurations for a project, the Debug configuration and the Release configuration. Each of these configurations has a set of properties that affect the way your program runs and is debugged. The default settings for the two configurations are shown in Table 3-1.
| CONFIGURATION | DESCRIPTION |
|---|---|
| Debug configuration | Generates PDB file |
| Sets IsJitTrackingEnabled to true | |
| Sets IsJitOptimizerDisabled to true | |
| Release configuration | Does not generate PDB file |
| Sets IsJitTrackingEnabled to false | |
| Sets IsJitOptimizerDisabled to false |
You can alter the default settings shown in Table 3-1 using the Visual Studio project properties dialog window. To control the setting of the IsJitTrackingEnabled flag and the generation of the debug symbol file for aVisual Studio project, right-click that project in Solution Explorer and select Properties ’ Configuration Properties ’ Build. There you can see and set an option called "Generate debugging information". Within Visual Studio, there is no way of controlling the .pdb generation and the IsJitTrackingEnabled flag independently.
Setting of the IsJitOptimizerDisabled flag is similarly controlled for a project under Properties ’ Configuration Properties ’ Optimizations. The relevant option is "Enable optimizations".
One point of interest is that if you run your project under the Visual Studio debugger, the IsJitTrackingEnabled and IsJitOptimizerDisabled flags are both temporarily set to true so that you can debug your project regardless of any of the Visual Studio build settings.
Building from the Command Line
If you build from the command line, the two flags that control how easily you can debug your programs are /debug and /optimize . As shown in Table 3-2, they correspond directly to the two flags that I have been discussing.
| FLAG | DESCRIPTION |
|---|---|
| /debug:full /optimize - (equivalent of Visual Studio debug mode) | Creates PDB file |
| Sets IsJitTrackingEnabled to true | |
| Sets IsJitOptimizerDisabled to true | |
| /debug- /optimize+ (equivalent of Visual Studio release mode) | Does not create PDB file |
| Sets IsJitTrackingEnabled to false | |
| Sets IsJitOptimizerDisabled to false | |
| /debug:pdbonly (no equivalent mode in Visual Studio) | Creates PDB file |
| Sets IsJitTrackingEnabled to false | |
| Sets IsJitOptimizerDisabled to true |
The /debug Compiler Option
The /debug:full setting tells the compiler to generate all of the information necessary to debug your program fully. It ensures that the debug symbol file is created and that the IsJitTrackingEnabled flag of DebuggableAttribute is set to true .
The /debug:pdbonly setting tells the compiler to generate the debug symbol file, but sets the IsJitTrackingEnabled member of DebuggableAttribute to false . If you debug your program from within the Visual Studio IDE, this won't make any difference ”this setting is then equivalent to the /debug:full setting. If, however, you debug a program running outside the IDE, you will see only assembly code during debugging and you won't be able to step through the source code.
The /debug- setting tells the compiler not to generate the debug symbol file and sets the IsJitTrackingEnabled member of DebuggableAttribute to false . This means that you will only be able to debug by stepping through the processor-native code.
Because the /debug flag has an extra setting that has no Visual Studio equivalent (i.e., generating the debug symbol file without tracking information), the command line is slightly more flexible. This is most useful when you're building a production release of your application. By default, you don't necessarily want the debug tracking information, as this can be generated at runtime if necessary ”for more about this, see the "Debugging Production Applications" section in Chapter 4, which covers overriding debug settings at runtime. However, you must have the debug symbol files available if you ever want to debug your production programs.
The /optimize Compiler Option
The /optimize+ setting tells the compiler to optimize both the CIL code and the x86 code. This optimization process gives permission to the language and JIT compilers to rearrange code as they see fit in order to generate the fastest code possible. One minor problem with this is that it can cause confusion when source code shown in the debugger is not executed as you expect because of the compiler optimizations. Because the native code is optimized, there is no longer any guarantee of a direct match with the source code. You can see this discrepancy in the source window when certain source statements appear to be skipped or executed in a strange order. For a good example of this, see the "Debugging and Optimization" tutorial in the .NET Framework SDK documentation.
The /optimize- setting tells the compiler not to mess with the code. This means that you won't see any strange behavior when stepping through your source code, but the tradeoff is that the code may run slower.
Locating Debug Symbol Files
A .pdb file contains debug symbols and is essential for most debugging, unless you are happy to wade through pure assembly code. Even for modules or third-party components where you have no access to the source code, having a .pdb file means that you can see proper function names in the Disassembly window.
The .pdb files for your application need to be located by the Visual Studio debugger. Normally, the debugger searches for a program's debug symbol files in the same folder that the executable resides, which is where the build process places them by default. If this is not the right location, you need to tell the debugger where to find the symbols. To do this, go to the Solution Explorer window, right-click your solution, and select the Properties menu item. Under Common Properties ’ Debug Symbol Files, add any required paths.
Whenever you build a production release of your application, you must build the associated.pdb files and store them under version control with the corresponding source. Trying to debug a production application with out-of-date or mismatched debug symbol files is usually impossible . You can use the dumpbin utility to find the debug symbol file associated with an .exe or .dll. The following command line searches for the debug symbol file related to the executable JitTest.exe and reports a list of the folders that it searched:
dumpbin /PDBPATH:VERBOSE C:\Test\JitTest.exe
The dumpbin utility with the /PDBPATH flag searches the following folders:
-
The folder where the executable is placed
-
The location of the debug symbol file written into the executable, which is usually the location at the time that the executable was built
-
The search path configured within the Visual Studio IDE
-
The paths contained in the _NT_SYMBOL_PATH and _NT_ALT_SYMBOL_PATH environment variables
-
The Windows folder
This utility can be very useful when your breakpoints aren't being triggered and you need to verify that the executable file and debug symbol file are properly matched.
Locating Source Files
If you're debugging a solution that was started within the Visual Studio IDE, the debugger will normally have no problem in locating any source files that it requires. If, however, you're attaching to a process or doing remote debugging, you can tell the debugger where to find any necessary source files by using the Solution Explorer window. There you can right-click your solution, select Properties ’ Common Properties ’ Debug Source Files, and add any required paths to allow Visual Studio to find the source file. If Visual Studio makes a guess about the name or location of the source file that it needs to use, you can ask it to confirm its choice by going to Tools ’ Options ’ Debugging ’ General and selecting the "Confirm correct file was found when finding source" option. Of course, these source files don't need to be held locally ”you can use them even if they're on a remote machine.
EAN: 2147483647
Pages: 160