Experiences and Lessons Learned
CoSQ Model Usage LessonsRES encountered a number of experiences using the CoSQ model. Many questions arose about how to allocate costs to subcategories. There was quite a variation in the methods used to break down the actual costs to the defined cost bin. This was resolved by refining the subcategory definitions and by analyzing and comparing the sub-allocation algorithms used by the six target project leaders. It was necessary to have the project leader, rather than an administrator, generate the data because the project leader possessed the firsthand knowledge of project particulars, as well as good engineering judgment. Using the CoSQ Data to Understand the Impact of ImprovementTable 22.1 shows the RES distribution of total project costs into CoSQ categories, to track the impact of its improvement program over the years. Starting at CMM Level 1 in 1988, RES introduced its software process improvement (SPI) program. Using the results of tracking 15 projects, it achieved CMM Level 3 practices in a little over three years. As seen in Figure 22.2, at the Level 1 stage, RES's CoSQ fluctuated between 55 percent and 67 percent of total project costs and, by the time of reaching Level 3 process maturity in 1991, its CoSQ had dropped to approximately 40 percent of total project cost. In 1990, when RES was approaching CMM Level 3, RES's total CoSQ was about 45 percent of total project costs, and its ratio of conformance to nonconformance costs was approximately 1.5. In 1994, when RES was adopting a goal of CMM Level 4, RES's total CoSQ was about 24 percent of total project costs, and its ratio of conformance to nonconformance costs was approximately 3.0.
Figure 22.2. Tracking the Cost of Software Quality at RES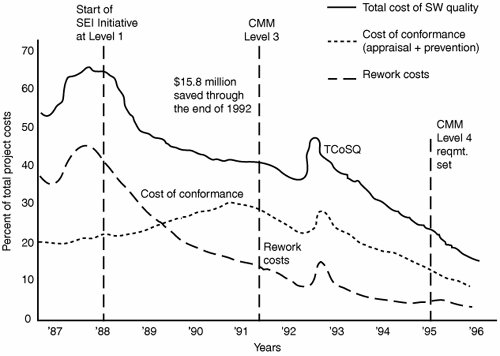 Rework Cost SavingsFigure 22.2 also shows the trend in the average costs of rework from the start of the improvement initiative. In the two years prior to the initiative, the rework costs had averaged about 41 percent of total project costs. In the two years following, that value had dropped to about 20 percent, and the trend was continuing downward. In 1995, CoSQ was approximately 25 percent of total project costs, and the rework due to both internal and external failures had been reduced to around 6 percent of total project costs. Rework savings were achieved at the expense of a small increase in conformance costs. For example, appraisal costs rose when informal reviews were replaced by formal inspections, and prevention costs rose when inspection training was instituted. Also, rework costs associated with fixing defects found during design rose from about 0.75 percent to about 2 percent of project cost, and those associated with fixing defects found during coding rose from about 2.5 percent to about 4 percent of project costs. The major reduction in rework costs was that associated with fixing source code problems found during integration, which dropped to about 20 percent of its original value. The second largest contributor to the rework reduction was the cost of retesting, which decreased to about half its initial value. This clearly indicates that the additional costs of performing formal inspections and the training that must precede it are justified on the basis of finding problems earlier in the process. Software QualityThe ultimate measure of quality is the contribution that software made to RES's success with software-intensive systems. Improvements made have enabled success on several major software-intensive programs and have allowed RES to tackle larger software projects. This was concretely demonstrated on several complex system projects by removing software from the critical path, and even delivering early, thus earning incentives. The primary quantitative measure that RES uses to assess overall product quality is the defect density in the final software products. This density factory is measured as the number of software trouble reports (STRs) per thousand lines of delivered source instructions (KDSI) on each project. The project densities are combined to compute a monthly weighted average to yield a time plot (trend chart) of the Software Quality Level (STRs/KDSI). As shown in Figure 22.3, the average level of quality improved from about 17.2 STRs/KDSI to about 4 STRs/KDSI, about four times improvement. Figure 22.3. Tracking the Level of Software Quality at RES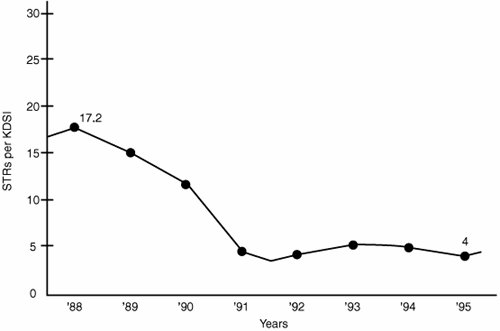 ProductivityData was collected from individual projects on their productivity in terms of equivalent delivered source instructions (EDSI) per man-month of development effort. The data was combined from all projects using a weighting function, and the results showed the average productivity was, in fact, increasing as a function of timemeaning that jobs were costing less. Overall, RES achieved a 170 percent increase in software productivity, as measured on 24projects over seven years. PredictabilityManagement needed to be reassured that the improved productivity figures were being used to bid new jobs. This issue was addressed by collecting CPI (Cost Performance Index) data on the project's budgeted (predicted) cost and actual cost at completion (CAC). This CPI ratio (CAC/Budget) for each project was then used to compute the monthly weighted average (using the same approach as the cost of quality) to yield a plot of this time-variant measure. The results were encouraging, showing that the cost performance index was improved dramatically from about 20 percent overrun prior to the start of the initiative to the 1 percent to 2 percent range by early 1993. Overall, the CPI (CAC/Budget) went from about 1.43 to 1.00 in the first three years and has been steady at about 1.00 since. Other ROI ResultsRES has won additional business based on its process maturity results (no amount reported). Software personnel work less overtime than before, and this has led to lower turnover rates. The overall payoff of its improvement program was reported to be 7.5 times (not including a $9.6 million schedule incentive award in 1991)for example, in 1990, it spent $1.1 million on improvements and determined that the cost of nonconformance was reduced by $8.2 million in that year. Other leading organizations have realized similar bottom-line benefits. CoSQ Costs and BenefitsCoSQ analysis cost RES about $25,000 of overhead for the first-time exercise. It repeated the CoSQ analysis exercise about a year later and added the analysis process to the normal senior management process reviews on a semi-annual basis. The CoSQ analysis used by RES was determined to be a viable mechanism for them to measure the overall effect of software process improvement. It can be used to isolate software waste/scrap and to try to drive it to zero. The information learned in applying the approach benefited the projects involved in the analysis by providing early feedback. The improvement of the organization's standard process was also facilitated. Institutionalization of CoSQ TrackingBy 1993, after three years, the data-gathering exercise for CoSQ had become more routine. Although the full analysis was being made semi-annually, some department managers were requiring their project leaders to provide the CoSQ data along with their normal monthly tracking data. In retrospect, more emphasis could have been placed on transitioning to a common work breakdown structure geared to the collection of CoSQ. | ||||||||||||||||||||||||||||||||||||
EAN: 2147483647
Pages: 394