Recipe 9.22. Calculating a Nice Axis
ProblemYou want to create a chart with a "nice" axis; that is, one with reasonable scaling numbers for a given number of tick marks and with a reasonably rounded increment for each tick value. These scale values should be chosen so the range of data points spans most of the length of the axis. SolutionSample code folder: Chapter 09\NiceAxis Use the NiceAxis() function presented here to calculate a reasonable axis given the minimum and maximum values of the data and the number of ticks along the axis. DiscussionThis function was created to solve the tricky problem of determining a reasonable plotting axis for a range of numbers. When manually determining a scale, it's easy to accidentally scrunch the data points too closely by choosing a scale with larger than necessary values or a scale with awkward fractional values at each tick mark that make mental interpolation of intermediate values nearly impossible. This function solves these problems by automatically choosing reasonable values for a chart's axis. In many cases you will want to call this function twice, once for the X-axis and once for the Y-axis. Pass this function the minimum and maximum data values to be plotted, and the number of divisions or tick marks along the axis. The calculations in the function iterate to find division steps that are reasonable and that still allow all data points to fall within the range of the axis. Here's the code for the NiceAxis() function: Public Function NiceAxis(ByVal minimumValue As Double, _ ByVal maximumValue As Double, _ ByVal divisions As Double) As Double() ' ----- Determine reasonable tick marks along an axis. ' Returns an array of three values: ' 0) minimum tick value ' 1) maximum tick value ' 2) tick mark step size Dim axis(2) As Double Dim trialDivisionSize As Double Dim modFourCount As Double = 1 Dim divisionSize As Double ' ----- Get the starting values. divisionSize = (maximumValue - minimumValue) / divisions trialDivisionSize = 10 ^ Int(Math.Log10(divisionSize)) ' ----- Iterate until we arrive at reasonable values. Do While (maximumValue > (trialDivisionSize * _ Int(minimumValue / trialDivisionSize) + _ divisions * trialDivisionSize)) modFourCount += 1 If ((modFourCount Mod 4) > 0) Then trialDivisionSize = 8 * trialDivisionSize / 5 End If trialDivisionSize = 5 * trialDivisionSize / 4 Loop ' ----- Return the results. axis(0) = trialDivisionSize * _ Int(minimumValue / trialDivisionSize) axis(1) = axis(0) + divisions * trialDivisionSize axis(2) = (axis(1) - axis(0)) / divisions Return axis End Function This function shows a good example of returning an array. In this case the array returns the minimum and maximum values for the ends of the nice axis, and the step size for the numbers along the tick marks or divisions along the axis. The following code provides a working example. NiceAxis() is called with minimum and maximum data values of 3.4 and 3.27, and 10 tick marks are requested along the scale of this axis. As shown in Figure 9-32, the function returns the nearest whole-number values for each end of the axis (4 and 6) and a recommended whole step size of 1 for each tick mark: Dim result As New System.Text.StringBuilder Dim axis() As Double = NiceAxis(-3.4, 3.27, 10) result.AppendLine("Minimum Value: -3.4") result.AppendLine("Maximum Value: 3.27") result.AppendLine("Divisions: 10") result.AppendLine() result.Append("Axis Minimum: ") result.AppendLine(axis(0).ToString) result.Append("Axis Maximum: ") result.AppendLine(axis(1).ToString) result.Append("Division Steps: ") result.AppendLine(axis(2).ToString) MsgBox(result.ToString()) Figure 9-32. The NiceAxis( ) function returns end points and the division step size for a nicely scaled chart axis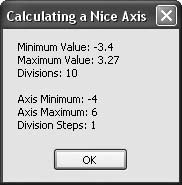 |
EAN: 2147483647
Pages: 400