13.6. The Art of Debugging Imagine, for an instant, that your animation isn't behaving the way you think it should. Testing it on the Stage or in Flash Player and then eyeballing the results, as described in the previous section, is a good place to start tracking down the problem. But if you've added ActionScript to your animation, chances are you need more firepower. You need to be able to step through your animation frame by frame and examine the inner workings of your ActionScript codethe variables , instance names , function calls, and so onto help you figure out what's wrong. You need the Flash debugger, shown in Figure 13-11. Unfortunately, unless you're familiar with ActionScript, much of the information the debugger displays isn't helpful. But even if you're new to ActionScript, the debugging tools you see in this section will give your bug-fixing skills a boost. Because the Flash debugger shows you a combination of ActionScript code and the Flash object model, its usefulness in debugging your animations is directly proportional to your knowledge of these two things. Figure 13-10. Oh, what a difference a faster connection speed makes! Here, every last one of the frames in the animation appears below the red line that Flash has drawn at 10.9 KB, meaning that audiences running T1 connections don't have to wait one split second for the animation to download and begin playing. 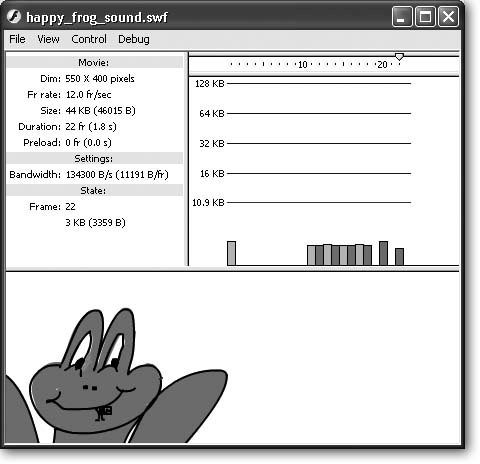
For example, if you have no idea how function calls work or what parameters a specific ActionScript function call requires, seeing the function call displayed in the debugger isn't going to help you figure out whatif anythingis wrong with the call. It's the same with the objects you add to your animations (Figure 13-12, middle) and the object properties and methods that Flash creates for you each time you add an object (Figure 13-12, bottom). Luckily, some of Flash's debugging tools are more accessible than others. The next three sections cover different debugging strategies, all of which are both simple to use and most helpful in tracking down problems.
Note: Flash lets you debug your animations remotely after you've uploaded them to a Web server. This book doesn't cover remote debugging, but you can find out more about it in Flash's help files.
13.6.1. Using the trace() Statement The ActionScript trace() statement isn't the only way to debug your ActionScript code, but it's by far the easiestand it delivers the biggest bang for your debugging buck, too. The trace() statement is the hammer in your Flash debugging toolkit: straightforward, dependable, and useful in so many different types of situations that even ActionScript pros routinely use it to figure out why their code isn't working properly. Here's how it works. You add a trace() statement to the action you suspect may be causing a problem. Then, when you test your animation, Flash prints out the contents of that statement in the Output window so you can examine them. This section explains the process step by step. UP TO SPEED
The Flash Player View Menu Options | | Flash Player offers several menu options you can use to change the way your animation appears as it's playing. If you turned on the checkbox next to Display menu in the Publish Settings dialog box (Figure 14-1), your audience can see some of these same options, by right-clicking (Windows) or Control-clicking (Mac). Note: If you're running a Mac, the following menu options don't appear directly in Flash Player; instead, they appear in the Flash menu. -
View  Zoom In . Tells Flash to enlarge your animation. This options useful if you want to examine your artwork close-up. Zoom In . Tells Flash to enlarge your animation. This options useful if you want to examine your artwork close-up. -
View Zoom Out . Tells Flash to shrink your animation. -
View Magnification . Displays a menu of percentage options you can choose from to tell Flash to enlarge or shrink your animation. -
View Bandwidth Profiler . Creates a bandwidth profiler report (Section 13.5.1.1). -
View Streaming Graph . Tells Flash to display download data in stacked bars when it creates a bandwidth profiler report (Figure 13-8). -
View Frame By Frame Graph . Tells Flash to display the download time for each frame separately when it creates a bandwidth profiler report (Figure 13-9). -
View Simulate Download . Tells Flash to pretend to download your animation from a Web server based on the download settings you select using View Download Settings. -
View Download Settings . Displays a list of connection speeds, from 14.4 to T1, to test the download speed of your animation on a variety of different computers. -
View Quality . Tells Flash to display your animations artwork in one of three different quality modes: low, medium, or high. Flash assumes you want high quality unless you tell it differently. (Choosing low or medium quality doesn't reduce simulation download time, but reducing image quality in the Flash authoring environment does reduce your animation's file size , which in turn speeds up download time.) -
View Show Redraw Regions . Displays borders around the moving images in your animation. |
To add a trace() statement to an action: -
Open the file reverse_debug.fla . If you're playing along at home, you can download this animation from the "Missing CD" page at www.missingmanuals.com/cds. Figure 13-11. The Debugger shows you what Flash is thinking behind the scenes. This panel shows the instance names, property values, variable names and values, and other ActionScript keywords and statements that either you (or Flash) added to your animation. 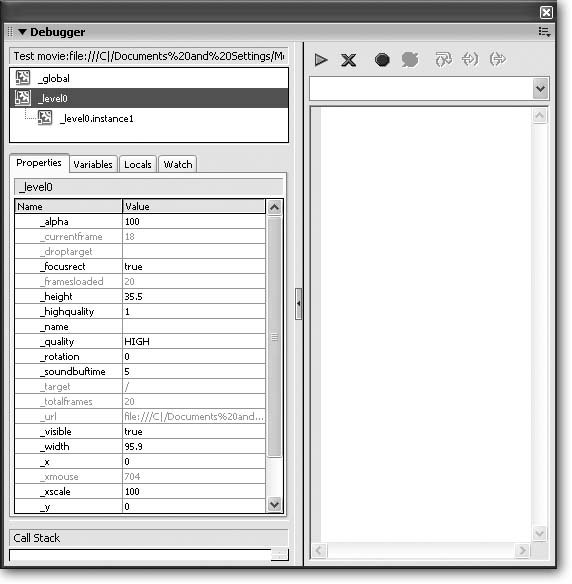 When you open the file, you see a one-frame Timeline and an instance of a movie clip (Figure 13-13). -
On the Stage, click the instance to select it . -
Select Window Actions . The Actions window appears, containing the two separate actions in Figure 13-13. -
Select Window Library . The Library panel appears, containing a single movie clip symbol named rollerball . Time to test the clip, so you can start tracking down the problem, as described next. -
In the Library panel, click rollerball. Then, in the same panel's preview pane, click the Play button . In the preview pane, the ball rolls from left to right, and the word "Flash!" grows from small to large. Figure 13-12. Top: Even the basic debug menu options that appear in Flash Player produce output that's pretty much incomprehensible unless you're an ActionScript code jockey.
Middle: For example, here's what choosing Debug List Objects dumps to the Output window for one animation. You can tell Frame 15 contains three instances of a button symbol and three chunks of text, but not much else.
Bottom: For the same animation, selecting Debug List Variables creates this report. Section 13.6.1 shows you how to create a friendlier report using the ActionScript trace() statement. 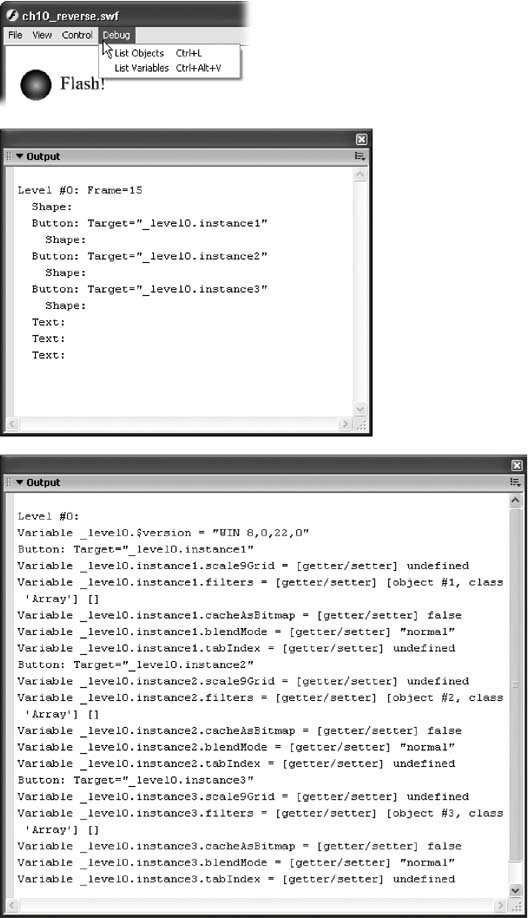 Figure 13-13. Here are two actions attached to an instance of the rollerball movie clip. The first action tells Flash to go immediately to the last frame of the move clip. The second action tells Flash to back up one frame the instant it enters a frame. So when the playhead enters the last frame, as instructed, Flash immediately plays the previous frame, then the frame before that, then the frame before that, and so on. 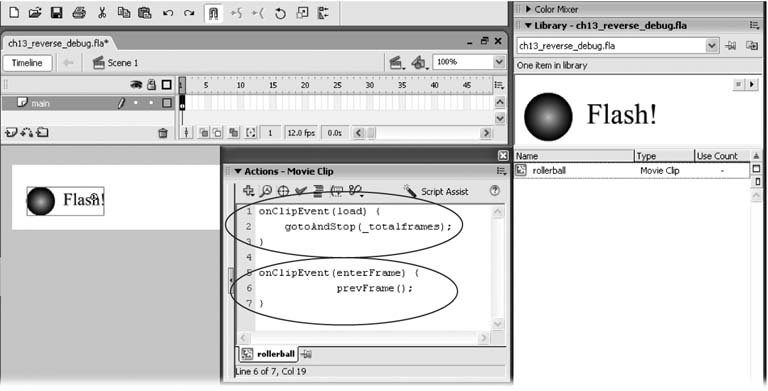 -
Test the animation by choosing Control Test Movie . In the Flash Player that appears, the movie clip appears to run backwards : The ball rolls from right to left, and the word "Flash!" shrinks. The animation doesn't repeat: one time through, and it stops. This is exactly the result the ActionScript code was designed to produce, so at first blush, everything seems A-OK. But if you leave the Flash Player up and continue working in Flash for any length of time, Flash begins to respond sluggishly. ( Very sluggishly after a couple minutes.) -
In the Flash Player, choose File Close . The Flash Player disappears. Since you can't yet be sure which script action's causing the problem, add the trace() statement to both of them: -
In the Actions panel, click in the Script pane and type the following ActionScript addition to the first action : trace("last frame of clip is " + _totalframes); -
Using the same procedure, add the following addition to the second action : trace("currFrame is " + _currentframe); The text phrases "frames total in this clip" and "currFrame is " aren't strictly necessary, but they do add a welcome human touch: These snippets of text make the trace output much more readable. Figure 13-14 shows what your Actions panel should look like. -
Test the animation again by selecting Control Test Movie . Flash Player appears, once again showing the movie clip running backwards. But another windowthe Output windowalso appears. As Figure 13-15 shows, the Output window displays the contents of the trace() statements you added to your actions. Your job as debugger-in-chief is to watch for the results of the trace statements in this window and see what they reveal about how the animation is working (or not working). Figure 13-14. The trace() statement displays the contents of a single parameter. (A parameter can include both text and variable names, as long as you remember to include a + sign to string them all together as shown here.) In this example, the ActionScript code references both the _totalframes and _currentframe variables, so it's important to see what Flash thinks the contents of these variables are as the animation runs its course. 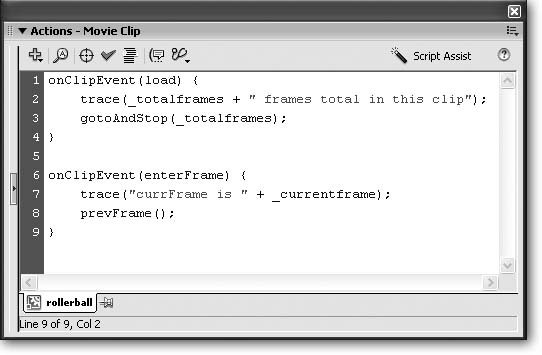
Tip: If you don't see your trace statement in the Output window, select File Publish Settings Flash, and make sure the checkbox next to "Omit trace actions is turned off.
As Figure 13-15 explains, Flash appears to be trying to back up one frame even after it's reached the first frame of the movie clip. So, one possible bug fix is to check whether or not Flash has reached the first frame, and if it has, to tell it to stop trying to back up.
Note: In programming circles, this kind of never-ending behavior is called an endless loop . Endless loops are pretty serious bugs , because they chew up computer resources in the background without contributing anything useful.
Flash guru that you are, you'll make a slight adjustment to the second action based on the results shown in the Output window (and in Figure 13-15). Now that you have a plan in mind, close Flash Player (File Close), and go on to the next step. -
The contents of your Actions panel should look similar to the one in Figure 13-16. Figure 13-15. As the animation runs, Flash obediently displays the contents of the trace() statements it encounters. Flash detected 21 frames in the movie clip (in other words, the value of the _totalframes property is 21). Then, as expected, Flash immediately printed out the contents of the second trace() statement, at which point the value of _currentframe was 21. Then Flash backed up one frame. As it entered the previous frame, it encountered the second trace() statement once again, so once again it printed the value of the _currentframe variable (this time, the value was 20). Flash backed up again. This time, the value of _currentframe was 19. And so on. So far, so gooduntil the value of _currentframe hit 1. As you can see by the Output window's scrollbar, after Flash had backed up all the way to the first frame it got stuck, encountering that second trace() statement over and over and over again. 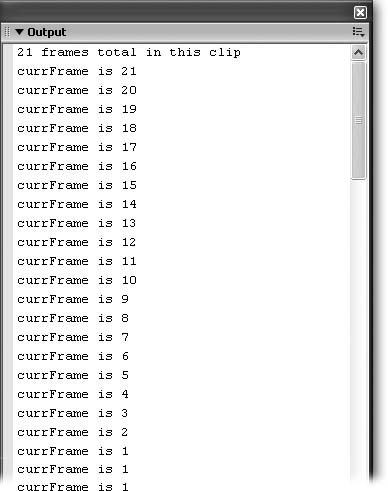 Figure 13-16. The great thing about using trace() statements is that they offer instant gratification. You can add as many as you like to your actions, and you can dump out the contents of as many variables as you like. In this example, the fact that there are only two ( fairly short) actions makes debugging relatively easy. But even in larger, complex actions, trace() statements can help you identify buggy code in short order. Of course, a requirement for using trace() statementsor any other debugging strategy, for that matteris that you know what the contents of any given variable should be during the course of the animation (so that you'll know when Flash prints out variable contents that are incorrect). 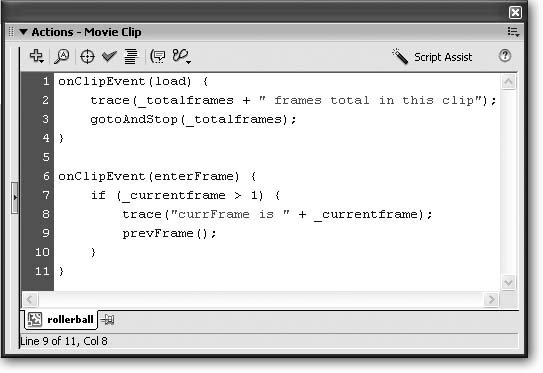 -
Retest the animation by selecting Control Test Movie . Once again, Flash Player appears, showing the movie clip running backwards. But this time the content in the Output window has changed, as Figure 13-17 shows. Success! Figure 13-17. Problem solved ! As you can see here, Flash steps backward frame by frame from the last frame (21) to the second frame, backs up one more time, and then stops; it doesn't keep trying to back up to a nonexistent Frame 0 the way it did before. 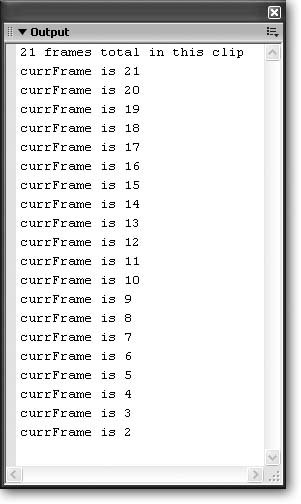 -
Return to the Actions panel and delete the trace() statements you added earlier. Close the Actions panel when you're done . After you've fixed a bug, you'll want to remove the trace() statements you added to your ActionScript code. The Output panel doesn't appear when you publish your animation (in other words, your audience won't see your trace() statements), but it's still a good idea to remove any unnecessary statements. Cleaning up keeps your ActionScript as short and uncluttered as possible. (Or, you can conceal them in comments as described in the box below.) TRICK OF THE TRADE
Comment Me Out | | If you're planning to keep working on your ActionScript action and think you'll need to reuse these trace() statements at some point down the road, you don't have to delete them and then type them in again later. Instead, you can "comment them out" by placing two slashes in front of each line, like this: // trace("currFrame is " + _currentframe);
When you stick two slashes at the beginning of a line of ActionScript code, Flash ignores everything it finds on the line after those slashes. In other words, it treats the code as if it were a plain old comment (Section 13.1.1). Later, when you want to use that trace() statement again, all you have to do is remove the slashes and you're back in business. |
UP TO SPEED
Deciphering the Actions Panel's Color Code | | One quick way to spot problems in your ActionScript code is to examine the colors Flash uses to display your code in the Actions panel. Right out of the box, Flash displays ActionScript keywords in blue, comments in light gray, text strings (text surrounded by quotes) in green, and stuff it doesn't recognize in black. So if you notice a function call or a property that appears black, you know there's a problem. Properly spelled function calls and properties should appear blue, so if they're black, chances are your finger slipped. In the example you see below, for example, the function gotoAndStop() is misspelled gotoAnddStop() , and the property _currentframe is misspelled as _currentframes . If Flash's ActionScript coloring scheme is too subtle for your tastes, you can change the colors it uses. To change colors: -
Select Edit Preferences (Windows) or Flash Preferences (Mac). -
-
Click the color pickers next to Foreground, Keywords, Identifiers, Background, Comments, and Strings to choose different colors for each of these ActionScript code elements. For example, if you have trouble making out the text strings in your scripts due to red-green color-blindness, you can change Strings to a different hue. 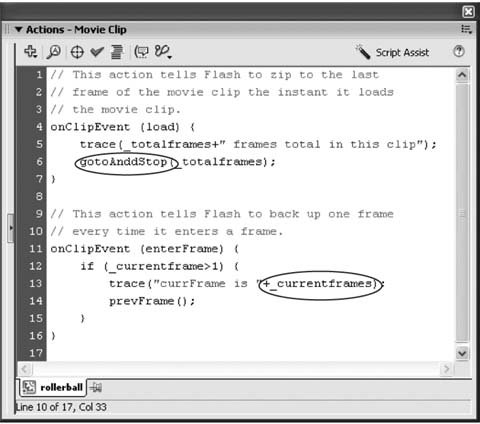 |
13.6.2. Displaying Property Names and Values The trace() statement lets you examine the contents of individual properties while your animation is running. But if you want to examine the contents of all the properties in your animation in one fell swoop, there's an easier way, using the Debug Movie command. The Debug Movie command lets you choose any movie clip in your animation (even one you've nested in another movie clip), view all the properties for that movie clip, and even change editable properties on the fly. -
Select Control Debug Movie . Flash pops up the debugger panel shown in Figure 13-18. -
In the display list, click the name of the Timeline you want to examine . In the Properties tab, Flash lists all the properties the Timeline contains, including values for properties that have them. Figure 13-18. In the display list, Flash lists your main animation (_level0) and any nested Timelines (movie clips) you've added to your main animation. Here, the movie clip instance named instanceOnFirstFrame is selected, so all the property names and corresponding values in the Properties tab belong to that movie clip instance. Selecting _level0 shows property names and values associated with the main animation. 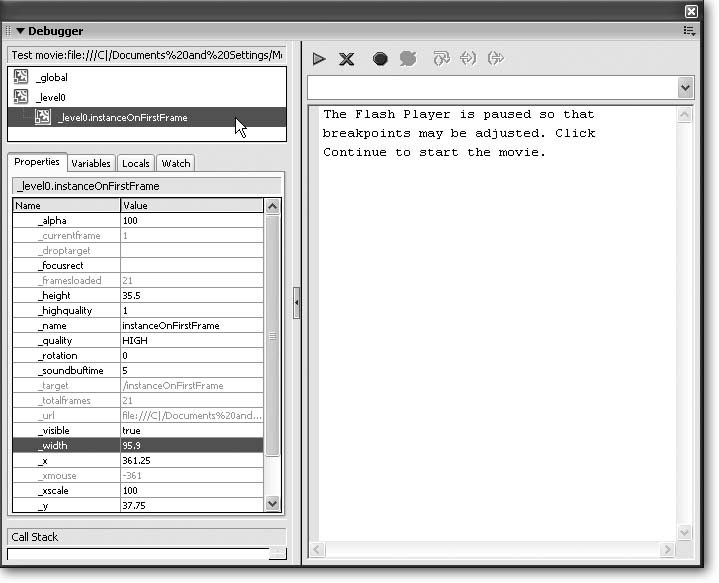
Figure 13-18, for example, shows that there are 21 total number frames in the movie clip instance ( _totalframes ), Flash has succeeded in loading all 21 ( _framesloaded ), and the playhead's currently on Frame 1 ( _currentframe ).
Note: Technically, you can let Flash name your symbol instances (instance1, instance2, and so on). But for debugging purposes, naming your instances yourself makes identifying them much easier. To name a symbol instance, select the instance on the Stage and then, in the Property Inspector, type the name you want into the "Instance name" field.
13.6.3. Setting and Using Breakpoints One of the most important debugging tools in any well-stocked ActionScript programmer's arsenal is the breakpoint . A breakpoint is an artificial stopping pointsort of a roadblockthat you can insert into your ActionScript code to stop Flash Player in its tracks. Setting breakpoints lets you examine your animation at different points during playback so that you can pinpoint where a bug first occurs. Flash lets you set breakpoints at specific lines in your ActionScript code. Setting a breakpoint lets you play the animation only up until Flash encounters that breakpoint. The instant Flash encounters a line with a breakpoint, it immediately stops the animation so that you can either examine object property values (as described in the previous section) or step through the remaining code in your action slowly, line by line, watching what happens as you go. Setting breakpoints is a great way to track down logic errors in your ActionScript code. For example, say you've created a chunk of code containing a lot of ifelse and dowhile statements. Stopping playback just before you enter that long stretch of code lets you follow Flash as it works through the statements one at a time. By stepping through statements in the order Flash actually executes them (as opposed to the order you thought Flash was supposed to execute them), you may find the cause of your problem is that Flash never reaches the else section of your ifelse statement, for example, or never performs any of the statements inside your dowhile block because the while condition is never met.
Note: For more information on using if else, dowhile , and other logical statements in ActionScript, check out Colin Moock's ActionScript: The Definitive Guide (O'Reilly). It has detailed coverage of more advanced ActionScript topics that are beyond the scope of this book.
To set a breakpoint: -
Open the file reverse_debug.fla. (It's the same one used earlier in this chapter; see Section 13.6.1 for download instructions.) A one-frame movie containing an instance of the rollerball movie clip symbol appears in your workspace. -
On the Stage, click the instance of the movie clip to select it . Flash displays a blue selection box around the movie clip. -
Select Window Actions . The Actions panel in Figure 13-19 (top) appears. -
In the Action panel's Script pane, click anywhere on line 12 . -
Click the down arrow next to the Debug options icon, and then choose Set Breakpoint (Figure 13-19, bottom) . In the Script pane, Flash displays a red dot next to line 12 to let you know you've successfully set a breakpoint.
Tip: Another way to set a breakpoint is to click in the Script pane just to the left of the Line number at which you want to set a breakpoint. When you do, Flash displays the breakpoint icon (the red dot). To remove the breakpoint, simply click the red dot.
-
Select Control Debug Movie . The Debugger panel appears. -
In the Debugger panel, click the Continue icon . Flash begins playing the animation, and then stops. In the Script pane of the Debugger panel, there's a small red arrow pointing at the line where Flash stopped (in this case, in Figure 13-20, that line is Line 12). Figure 13-19. Top: You have to click on a line of ActionScript code before Flash lets you set a breakpoint.
Bottom: After you select Set Breakpoint, Flash shows a little red dot next to the breakpoint line. You can add as many breakpoints to your code as you like, with one caveat: You can add a breakpoint only to a "live," or executable, line of code. For example, you can't add a breakpoint to a line containing nothing but a closing brace , such as Line 15 or 16. 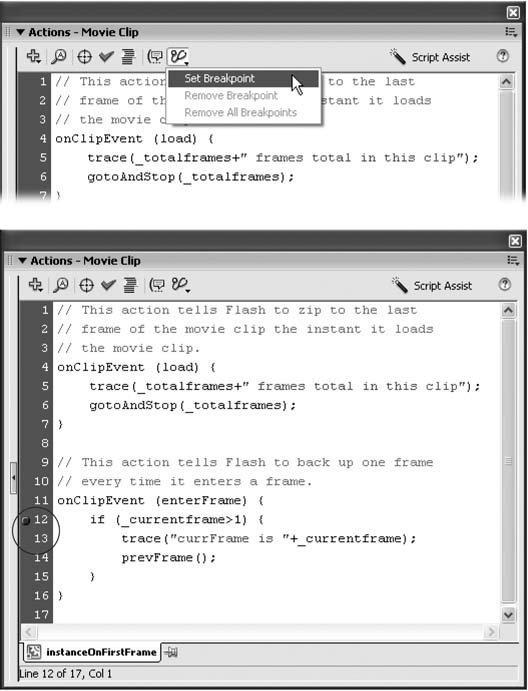 Now you can step through the remaining ActionScript code line by line. -
Click the Step Over icon at the top of the Debugger panel (labeled in Figure 13-20) . Flash executes Line 12 and moves to Line 13, as in Figure 13-21. -
Click Step Over again . Flash executes Line 13 and moves to Line 14. In the Output panel, you see the results of Flash having executed Line 13: the message "currFrame is 21." -
Continue clicking Step Over until either the animation finishes playing or you spot a problem . Figure 13-20. Flash displays the contents of the trace() statement in the Output window because the trace() statement is on Line 5, and Flash doesn't stop playing the application until it encounters the breakpoint on Line 12. At this point, you can examine your animation's object properties and values (see Section 5.2), or you can step into the ActionScript code as shown below. 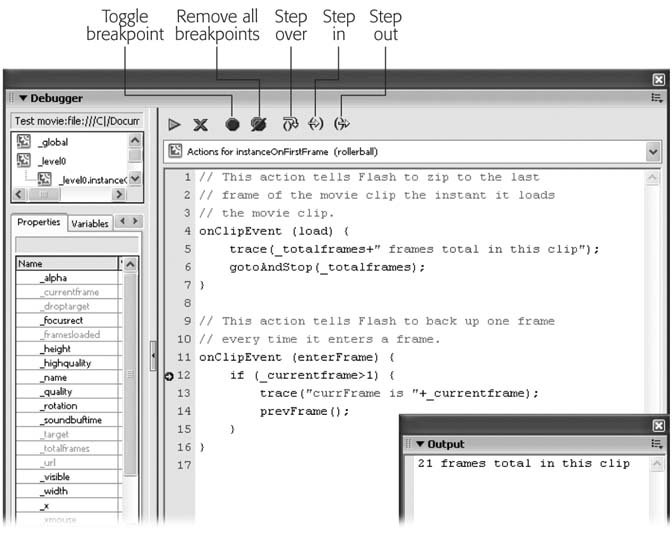
Figure 13-21. Flash always displays the breakpoint icon (the red dot) next to the line where you set the breakpoint. But as you step through your code, Flash moves the yellow arrow so that you always know which line Flash will execute the next time you click Continue. 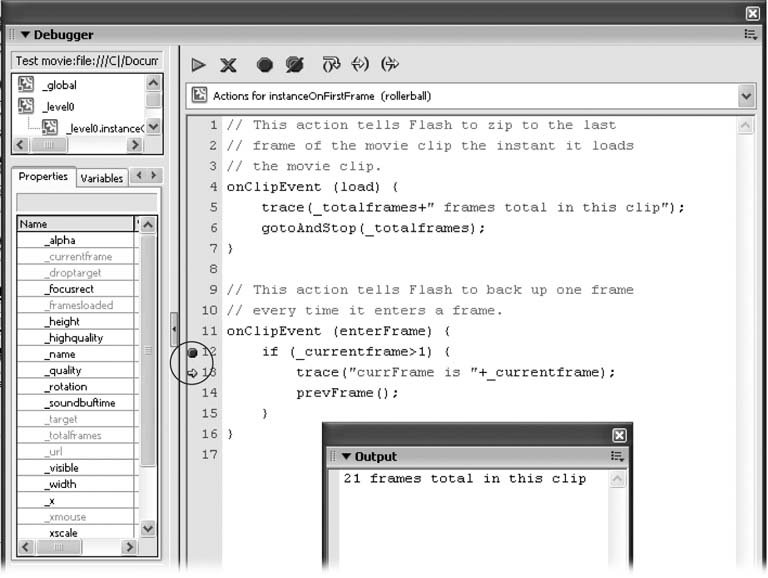
Note: Stepping over a line of code, as shown in this example, tells Flash to execute the line of codeeven if the line happens to contain a function call. But if you want to explore the inner workings of a function call, you can set a breakpoint at a line containing a function call, and then click Step Into. This action tells Flash to step into the called function and begin working through each line of the called function. To pop back out of the called function and return to the calling code, click Step Out.
|