16 - The Appropriateness and Effectiveness of Stroke Prevention
Editors: Norris, John W.; Hachinski, Vladimir
Title: Stroke Prevention, 1st Edition
Copyright 2001 Oxford University Press
> Table of Contents > III - Prevention: Policy and Practice > 16 - The Appropriateness and Effectiveness of Stroke Prevention
16
The Appropriateness and Effectiveness of Stroke Prevention
Thomas E. Feasby
The recent introduction of tissue plasminogen activator (t-PA) for the treatment of acute stroke has energized the field of stroke care and directed attention toward acute treatment. This is long overdue. However, because of major access barriers, most eligible stroke patients will not be treated, and many other patients will not be eligible. Thus, stroke prevention is likely to remain the most important approach to decreasing its incidence and the disability resulting from stroke.
This chapter concentrates on carotid endarterectomy as a model of stroke prevention therapy. The general importance of quality care and its measurement are discussed. One important quality process measure, appropriateness, is covered in detail. Finally, the measurement of effectiveness is introduced. It it illustrated with a new method to measure the effectiveness of carotid endarterectomy in series of clinical cases.
Defining Quality of Health Care
Measurement of the quality health care is becoming increasingly important to patients, providers, health care businesses, and employers.1,2 Efforts to improve the quality of health care are critically dependent upon the measurement quality.3,4,5 Informed choice for patients requires readily available comparative quality data, not just efficacy data from randomized clinical trials. Patients, health
P.296
are businesses, and payers need quality-of-care information to determine cost effectiveness.
The Institute of Medicine has defined quality health care as the degree to which health services for individuals and populations increase the likelihood of desired health outcomes and are consistent with current professional knowledge .6 In this definition, health services refers to the broad range of services that affect health, including those that promote health, prevent disease, treat acute illness, and provide rehabilitation. The perspectives of populations and individuals must be considered, the latter including patients and health providers. Desired outcomes are those that patients value, not just the objective outcomes that clinicians have traditionally valued. The phrase increases the likelihood of good outcomes is a reminder that high-quality care does not always result in good outcomes, and patients may do well despite poor quality of care. This emphasizes the need to examine both processes and the outcomes of care. The last qualifier, consistent with current professional knowledge, indicates the need for clinicians to continually update their knowledge of the current literature be able to apply the best evidence in their management of patients.
Problems with the quality of health care may be classified into three categories, overuse, underuse, and misuse.2 Overuse is when a health service provided when its potential for harm exceeds benefit. Clearly, it is inappropriate. An example relating to stroke would be the use of an EC/IC bypass treat a transient ischemic attack (TIA) due to moderate carotid stenosis. The efficacy data suggest that this would be ineffective. Underuse is the failure to provide an appropriate service when it would be expected to produce a favorable outcome. For example, underuse would be the failure to provide TPA to an eligible acute stroke patient who was treatable under three hours from stroke onset. Misuse happens when an appropriate service is provided but an avoidable complication results in the patient receiving less than the full potential benefit. An example relating to stroke would be a patient receiving coumadin for atrial fibrillation who has a stroke because poor monitoring allowed the INR to fall too low.
Each of these types quality-of-care problems is very common. Recent studies, for example, have shown that at least 21% of all U.S. antibiotic prescriptions given to ambulatory patients were used for upper respiratory infections in which they would not be expected to be effective.7 The risks posed by this poorquality practice include drug reactions, superinfections, and the development of antibiotic resistance. This is a serious problem of overuse.
Underuse is widespread and leads to lost opportunities improve health well-being. The undertreatment of hypertension, a proven preventive technique, results in many unnecessary strokes. j8-blockers have been shown to reduce mortality after myocardial infarction but are grossly underused in practice.8
Unfortunately, misuse, the occurrence of preventable complications treatment, is also frequent. Although misuse can be caused by error, not all errors are
P.297
misuse because most do not result in harm and many are corrected before harm occurs. However, the wide range of perioperative complication rates reported for series of carotid endarterectomy cases not explained by differences in case mix suggests that misuse may be common. One study of U.S. Medicare patients hospitalized with congestive heart failure showed that those who received poorquality care had a 74% greater mortality rate within 30 days than those who received good-quality care.9
In efforts to improve quality, sight must not be lost of the effects on cost, given the constraints on the health care system. Directives are frequently given to do more with less. Is it possible? The answer in terms of the cost quality improvement is yes and no .2 Reducing overuse clearly improves quality by reducing unnecessary risk and nuisance but also reduces costs by decreasing the number of procedures or treatments. Reducing misuse also improves quality by sparing patients misfortune and by improving outcomes. Cost will also be reduced. A recent study of patient harm showed that when preventable therapeutic drug errors occurred, the cost of each hospital stay was increased by almost $5000.10 The conflict comes with underuse. There is no doubt about the improved health outcome, including stroke prevention, from the increased appropriate use of antihypertensive and anticholesterol treatment. Determining the effect on cost is more difficult. Most efforts to rectify underuse result in increased initial costs. Whether the costs of prevention or deferral disease disability will result in cost savings is unknown.
Measuring the Quality of Health Care
For the purpose of measurement, the quality health care can be separated into the domains of structure, process, and outcome.11 Structure includes physical facilities, such as hospital size and type, protocols, equipment, the qualifications of the staff. These are the usual purview accreditation boards, but they relate uncertainly to process and outcomes. Process includes all things that are actually done to and for patients. This involves the technical aspects of care and its competence, and also the art of medicine. That is, was the right choice of treatment made and how well was it done? One process measure that has been employed widely to examine whether the choice of treatment was right is appropriateness. This provides a contemporary measurement of process incorporating best evidence and informed opinion. It is discussed in detail relation to stroke prevention below. Process measures are those most frequently used. They relate to evidence of best practice, and the deficiencies they reveal should be amenable to improvement.
Outcome is the most obvious quality measure, but not always the best. Even when the outcome measure is mortality, its assessment presents challenges. Mortality has been used frequently in monitoring coronary artery bypass surgery, but problems can arise in comparing results between series of cases because insufficient
P.298
risk adjustment to compensate for differences in case mix.12 Mortality and morbidity, usually a combined stroke and death rate, have been used as outcome measures to assess quality in series of carotid endarterectomies. This approach ignores the expected good outcomes from treatment (i.e., prevention of stroke), probably because the difficulty in measurement. For this reason, the rate of complications after carotid endarterectomy is not a sufficient outcome measure.
Bad outcomes may also be unsuitable outcome measures because bad outcomes due to misuse may be uncommon. Most patients survive mishaps in care. Also, overuse is not detected by measuring outcome. Healthy patients who do not need a treatment are likely to fare better than those who are ill or at risk and should receive the treatment. Thus, overtreatment can result in better results when only the negative outcomes are measured.
Aggregate population measures of outcome are insensitive for examining the effect of changes in process. Measures such as infant mortality, longevity, or even stroke rate are subject to so many influences that attributing improvement or worsening to changes made in any particular intervention is almost impossible. To some extent, this is a signal and noise problem.13 If specific populations at risk are examined using specific outcome measures, the marginal benefits may be seen more easily.
Two quality measures are discussed in the following sections. The first is appropriateness, a process measure that has been applied widely to surgical procedures and to carotid endarterectomy, in particular. Its advantages and disadvantages will be considered. The second is effectiveness. This concept defined and a new approach to its measurement is outlined using carotid endarterectomy as the example.
Appropriateness, a Measure of Process
A method to measure the appropriateness of medical interventions was developed at the RAND Corporation in 1980s.14 This work was motivated by concerns that the increasing complexity of medical care was resulting in many patients receiving unnecessary care and others not necessary care.15 The method was based on the following principles: timeliness to produce a contemporary measure; the best medical evidence from literature; representation of a medical point of view (not one based on cost); and informed opinion from a multispecialty panel.
The first step in the process is a detailed review of relevant literature to obtain and grade the evidence for the indications, efficacy, effectiveness of the procedure being considered. Next, a list of indications for the is compiled and transformed into scenarios incorporating the patient's age, symptoms, co-morbidities, etc., under which the intervention might be performed. An attempt is made to create enough scenarios with sufficient specificity that the patients
P.299
in each scenario are reasonably homogeneous. The number of scenarios may exceed 1000 for some procedures. Reviewers assess the literature review and the compiled scenarios to detect and correct omissions or biases.
An expert panel of nine is recruited that includes experts in the procedure under study as well those with general and related expertise. Members are often recruited by asking specialty societies for nominees, and an attempt is made to ensure geographic diversity. The panel is chaired by a physician trained in epidemiology, statistics, or research design. The panelists then read the literature review and suggest revisions to it and the list of scenarios. Next, the panelists go through two rounds in which they rate the scenarios on the basis of appropriateness. The first rating is done individually. Then, a group meeting held to discuss and rate each of the indications. Discussion is encouraged to ensure thorough understanding of each scenario and the ratings.
The ratings are done on an ordinal, nine-point scale. Appropriateness is defined to mean that a procedure is worth doing if the expected medical benefit the patient (e.g., health status, quality of life, longevity) exceeds the expected negative consequences (e.g., disability, pain, risk of death).14 The scale contains three categories and allows a range within each category. Level 1 to 3 is inappropriate, 4 to 6 is uncertain, and 7 to 9 is appropriate. Using this system, each scenario is given a rating on the appropriateness scale. Cost not considered.
The ratings are then applied to a series of real cases. The data is collected by chart review, and each case is categorized according to the list of scenarios. Since each scenario has a rating on the scale, the overall level of appropriateness for series of cases can be determined. The method has been used to assess many therapeutic and investigative procedures, such as coronary artery bypass surgery, coronary angiography, coronary angioplasty, hysterectomy, colonoscopy, cholecystectomy, upper gastrointestinal endoscopy, and back manipulation.
The Appropriateness of Carotid Endarterectomy
The rate of carotid endarterectomy (CE) was high in the 1980s, when the first study of the appropriateness CE16 was done. The wisdom doing was almost unquestioned, but the evidence for efficacy was lacking; also, were marked regional variations existed in the rate of CE.17 The surprising results this study helped to fuel the drive for the randomized controlled trials of the 1990s, which truly determined the efficacy of CE.
Using the RAND appropriateness methodology, Winslow et al.16 developed 864 scenarios under which CE might be performed. The included various categories of symptomatic patients, several categories asymptomatic patients, and incorporated data about age, sex, comorbidities, degree of carotid stenosis measured angiographically. These scenarios were rated on the nine point appropriateness scale. The ratings were then applied by chart review to a random
P.300
sample of 1302 Medicare patients who underwent CE in three different geographic regions in the United States 1981.
In this study, 35% of the procedures were found to be appropriate, 32% were uncertain, and 32% were inappropriate. Of the inappropriate cases, about half had carotid stenosis of less than 50%. Fifty-four percent all the procedures were done in patients who did not have ischemic events the carotid territory. The authors concluded that there was evidence of substantial overuse CE in the regions studied.
Knowledge of CE and its efficacy improved markedly in the 1990s with the publication of the NASCET18,19 and ACAS20 trials. One would expect the appropriateness to have improved as well. Wong et al.21 carried out an appropriateness study of CE in Edmonton, Alberta, on patients operated in 1994 and 1995. They developed their appropriateness criteria in a different way; by reviewing the recent randomized controlled trials on CE and the clinical practice guidelines for CE published by the American Heart Association22 and the Canadian Neurosurgical Society.23 They then applied these criteria to 291 cases of CE by chart review. They improved their categorization of patients by remeasuring the carotid angiograms, allowing them to correct for misclassification. They found only a moderate agreement between the radiologists' original estimation of stenosis and the remeasured value (symptomatic stenosis: K = 0.72; asymptomatic stenosis: K = 0.67). They found that 33% of CEs were appropriate, 49% uncertain, and 18% were inappropriate. These results are no better than those of Winslow et al. almost 10 years earlier, where 35% of CEs were considered to be appropriate.
Wong et al. put the method to an interesting test, trying improve the level of appropriateness using an educational intervention.24 They provided all the surgeons with the results of their first study as well with current CE practice guidelines, and they let them know that there would be a prospective surveillance study. They then monitored the performance of CE for a year. The results this study were 49% appropriate, 47% uncertain, and 4% inappropriate. This was a significant improvement in the proportion appropriate (p = 0.0005) and a significant drop in the proportion inappropriate. Forty per cent of cases had asymptomatic carotid stenosis and represented the majority of those rated uncertain, as they had in the first study.
Two recent studies, one from Georgia and another Oklahoma, illustrate how sensitive an appropriateness study of CE is to the criteria chosen for appropriateness.25,26 The appropriateness study of CE from Georgia found results strikingly different from those Alberta. The authors did a retrospective review of the charts 1945 CE Medicare patients from 1993. They found that 96.1% of CEs were done appropriately. The appropriateness study 813 CEs on Oklahoma Medicare patients from 1993 and 1994 found an appropriateness level of 98%.26
P.301
Why are these results so different from the other studies? First, they used different appropriateness criteria. Both studies included as appropriate most patients who were asymptomatic. In fact, in the Georgia series, 51% of patients were asypmptomatic and in the Oklahoma series, 43%. This latter study accepted as appropriate both symptomatic and asymptomatic patients with 60% stenosis. Neither study included an uncertain category, and the authors did not independently remeasure the angiograms for validation. These factors, especially decision to classify asymptomatic patients as appropriate rather than uncertain, had a large effect on the outcome. It is clear that the appropriateness criteria and ratings chosen have a major impact on the results of this type study. The original RAND approach to the development of criteria still seems be the most valid approach.
Many other procedures have been assessed for appropriateness, the most relevant for comparison being coronary artery bypass grafting (CABG). This procedure has been under intense scrutiny since the late 1980s, beginning first in New York state, where outcomes for surgeons and hospitals were measured eventually published in the lay press as report cards. 12 The development of risk adjustment methods to adjust for differences in case mix reflecting differing baseline risks between different case series has improved the credibility of this process. Appropriateness measurement has also been applied to CABG. A study using the RAND methodology on American patients from 1979 to 1982 found that 56% were appropriate, 30% uncertain, and 14% inappropriate.27 More recent studies from the 1990s in the United States28 and Canada29 have shown levels of appropriateness (and necessity) of about 92% 95%.
It seems clear that appropriateness is a useful contemporary measure of process and quality of care, but it has limitations.30 It is very sensitive to the criteria of appropriateness and their derivation. Even when the RAND method is used, the gold standard for appropriateness, the reproducibility between panels is deficient.31 The ratings also vary depending on the specialty mix and background of the expert panels.32 Naylor stated that these methods are best regarded as rough screening tests for overuse and underuse of specific procedures. 30 In fact, these methods are not useful for detecting underuse. They assessing overuse, but their limitations are significant
Effectiveness as an Outcome Measure
In judging the quality of a medical intervention, effectiveness is the measurement of most value. However, when doctors discuss treatment options with patients, the measure of benefit usually cited is efficacy. Unfortunately, this not a suitable quality measure for most situations.15 Efficacy is the product of a randomized clinical trial (RCT), an experiment that tells us if a procedure works under ideal circumstances, and whether it is potentially useful.33 Efficacy answers the
P.302
question Can it work? Effectiveness is a better outcome measure, one which is similar to efficacy, except that it reflects the outcome of an intervention in the real world when it is applied by average physicians to patients in average circumstances. Effectiveness answers the question Does it work? Efficacy is often employed as if it were effectiveness, but it is likely that efficacy is an overestimate of effectiveness under most circumstances. This is because (1) restrictive entry criteria of RCTs often exclude higher-risk and older patients; (2) restrictive entry criteria for physicians18,19,20,33 may produce a higher quality of practice in an RCT; and (3) compliance with medical care is likely to be better in a trial. Underuse is the other major limitation to realization of full effectiveness of treatments. Although effectiveness is the outcome most importance, it is difficult to measure for several reasons. In clinical practice, patients are not randomized, so that an equivalent untreated comparison group is lacking. Valid and reliable data are often unavailable. Outcomes of interest may be delayed.
Randomized clinical trials have shown that /3-blockers can reduce the mortality of patients following acute myocardial infarction.34,35 The Norwegian Multicenter Study, a RCT of timolol vs. placebo in 1884 patients after acute myocardial infarction, showed a 6.2% absolute risk reduction in sudden death rate 33 months of follow-up.34 The j8-blocker Heart Attack Trial compared propranalol vs. placebo in 3837 patients after acute myocardial infarction. This study showed a 2.6% absolute risk reduction for mortality over 27 months of follow-up.35 The results of both studies were statistically significant (p < 0.005). The evidence for the efficacy of /3-blockers after myocardial infarction is thus clear, but what about its effectiveness, the real world equivalent of efficacy?
Soumerai et al.8 performed a retrospective cohort study in New Jersey using a database that linked Medicare and drug claims data from 1987 to 1992. The database allowed them to determine all Medicare patients in New Jersey who had acute myocardial infarction, what drugs were prescribed, and mortality over the two years post-myocardial infarction. They found that only 21% of eligible myocardial infarction patients received j3-blockers. However, in those who were prescribed the drugs, absolute risk reduction was similar to that shown in the RCTs. Therefore, the effectiveness in the treated population was similar to efficacy in the RCTs. However, on a population-wide basis, this treatment could not be considered effective because of underuse. A recent review articles published on quality of care in the United States from 1993 to 1997 showed that for studies of disease prevention, only about 50% of eligible people received the necessary preventive care.36 Underuse is the major reason why effectiveness of preventive care for an eligible population is less than efficacy.
Underuse also limits effectiveness in stroke prevention. A study of American health care plans showed that more than 50% of hypertensive patients did not have adequately controlled blood pressure.37 This suggests underuse and, therefore,
P.303
suboptimal effectiveness of a proven stroke preventative. Warfarin is also a proven stroke preventative in those with atrial fibrillation. A recent chart review study of Medicare patients hospitalized with ischemic stroke and atrial fibrillation in Connecticut showed that only 53% of the patients were prescribed warfarin at discharge, and 62% of those not given warfarin were aspirin, either.38
The ideal outcome measure of effectiveness should be objective and readily measured. It should also reflect the quality of care. An outcome that cannot be altered by changes in process is not useful as a measure of quality or effectiveness. Mortality has been used frequently in monitoring coronary artery bypass surgery, but its assessment presents challenges. Problems can arise in comparing results because of insufficient risk adjustment to compensate for differences in case mix.12 Also, when only mortality is considered, the anticipated good outcomes of prophylactic care are often ignored, perhaps because they more difficult to measure. This is especially so when the expected good outcomes may be considerably delayed, as in stroke prevention. An effectiveness measurement method that measures the outcomes of an intervention, incorporating both complications and the good outcomes, that is responsive to improvements in process is needed.
A Method to Measure Effectiveness
This section describes a method to estimate the effectiveness of treatment interventions in case series. Of necessity, this measure deals only with the population actually treated. Measuring effectiveness in the population at risk is also important but requires different methods. The example of CE is used, the method is suitable for other interventions, including other stroke prevention approaches. A more detailed description of the method is available.39
This method of measuring effectiveness incorporates the following principles and assumptions:
Randomized controlled trials are done with restricted categories of patients, unlike population-based case series (PBSs). For instance, a trial might enroll patients with a certain disease only if they were male and of a age. However, if there are sufficient categories of RCTs to account for the case-mix in the PBS, assuming that the baseline risk in the RCT category is similar to that in the PBS category, the efficacy data from RCTs can then be applied to the corresponding categories of PBS.
Efficacy results from RCTs must be adjusted for the difference in the intervention-induced mortality and morbidity between the RCT and the PBS before they can be applied to the categories of PBSs. Efficacy is a measure of the difference in outcome events between the control and the treated
P.304
(experimental) groups in a RCT. The outcome events caused by the intervention (e.g., surgical mortality/morbidity) are factored into the efficacy measurement, incorporated as part of the risk in the treated group. To apply efficacy results to a PBS with no control group, one must measure the rate of treatment-related events in the PBS, and use the difference between this rate and the rate in the RCT to adjust the efficacy results, so that an absolute risk reduction can be calculated for the PBS. Patients at high operative risk might receive surgery in a PBS, but would have been excluded from a RCT. This adjustment of efficacy for the PBS takes this into account by including the real perioperative mortality/morbidity, not just that from the RCT. It is assumed that the good outcome to be expected from intervention (e.g., prevention of stroke) will be the same in PBS as it was for the RCT, once this adjustment has been made. However, this assumption does not deal with the issue of possibly decreased life expectancy unrelated to the intervention in PBS, because of treatment patients advanced age or with comorbid conditions that may limit survival, patients who would not have been included in the RCT.Patients are accurately classified according to prognostic criteria at entry into RCTs. Classification in PBSs is likely to be less accurate. If possible, misclassification should be measured and corrected in analyzing the PBS.
The adjusted efficacy estimates for the reclassified categories of the PBS can be combined proportionately to yield an overall estimate of the effectiveness of the intervention.
Efficacy can be expressed in several ways.40,41 In epidemiologic studies, the relative risk (risk ratio, RR) is most commonly used. It is the ratio of the risk between the exposed (treated) and unexposed (control) groups. The relative risk reduction (RRR) is 1-RR and expresses the in risk due to treatment. The importance of this measure in RCTs is highly dependent upon the baseline risk in the control group.40,42 A large RRR is less impressive if the baseline risk in the control group is low. The absolute reduction (ARR, or risk difference) is the actual difference in between the control and intervention groups is a more robust indicator of efficacy in RCTs. The reciprocal of the ARR, 1/ARR, is the number needed to treat (NNT). The NNT is the number of patients who must undergo the intervention to prevent one outcome event during the follow-up period of the study.43 Effectiveness, like efficacy, can be expressed in all of the above ways, but the NNT is the most practical for clinical applications.
The major study of clopidogrel for prevention stroke and other vascular events affords a useful example.44 This RCT of 19,185 patients comparing the efficacy of clopidogrel to aspirin in preventing vascular events reported an RRR of 8.7%. However, the ARR was only 0.51% because baseline risk in the
P.305
aspirin-treated group was so low. Thus, the NNT to prevent one stroke over year using clopidogrel rather than aspirin was 196 patients. This way of expressing the result is much more meaningful than using an RRR of 8.7%. The NNT will be used in the following example of CE.
Example: The Effectiveness of Carotid Endarterectomy
Many RCTs have examined the efficacy of CE in the last ten years, allowing division of cases from a PBS into four groups on the basis degree carotid stenosis and whether they were symptomatic. Two major trials in symptomatic patients, the North American Symptomatic Carotid Endarterectomy Trial (NASCET)18,19 and the European Carotid Surgery Trial45 reported similar results. The results from NASCET will be used because they represent mostly North American patients and the measurement technique employed for carotid angiograms is the North American standard. NASCET reported on the efficacy of CE in symptomatic patients with 70% stenosis. The second phase of NASCET reported on efficacy in symptomatic patients with <70% stenosis.19 The figures for surgery on those with asymptomatic carotid stenosis 60% are taken from the Asymptomatic Carotid Atherosclerosis Study (ACAS). 20 The ARR for the asymptomatic group with <60% stenosis is unknown. Given that the ARR in the those with stenosis of from 60% to 99% was 1.5%,46 an assumption that the ARR was zero in the asymptomatic group with <60% stenosis seems reasonable. All figures are for two years of follow-up and are shown in Table 16.1.
The recent population-based series from the University of Alberta will be used to illustrate the effectiveness method. Wong et al.21 reported on 291 consecutive patients receiving CE in Edmonton, Alberta, over 18 months in 1994 and 1995. The data were collected by chart review. cases were classified as symptomatic and >70% or 50% 69% stenosis, asymptomatic >60% <60% stenosis. Furthermore, the carotid angiograms were remeasured using the
P.306
NASCET and ACAS criteria. This allowed detection of misclassification by degree of stenosis and permitted reclassification on the basis the correct measurement (Table 16.2).
TABLE 16.1. Results of Carotid Endarterectomy Clinical Trials | ||||||||||||||||||||||||
|---|---|---|---|---|---|---|---|---|---|---|---|---|---|---|---|---|---|---|---|---|---|---|---|---|
| ||||||||||||||||||||||||
TABLE 16.2. Alberta Endarterectomy Series Reclassified After Angiogram Remeasurement | |||||||||||||||
|---|---|---|---|---|---|---|---|---|---|---|---|---|---|---|---|
|
To calculate the effectiveness score (absolute risk reduction for the PBS, i.e., ARRiP) for each category (stratum), an adjustment is made in the efficacy score from the RCT (absolute risk reduction for the RCT, i.e., ARRR), based on difference between the perioperative mortality/morbidity rate (i.e., stroke and/or death) in the RCT (MR) and the PBS (Mp). For symptomatic >70% stenosis stratum in the Alberta series,
![]()
The effectiveness in this stratum is higher than the RCT because the perioperative stroke and/or death rate was lower in the Alberta series than NASCET. The ARRP for each stratum in series is then calculated as shown this example. The results are shown in Table 16.3.
The effectiveness scores (AAR?) for each stratum are then weighted by the proportion of cases in each category and summed to produce an aggregate effectiveness score for the PBS:
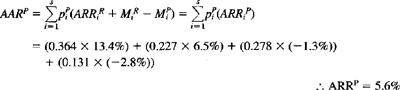
The ARR for the entire Alberta series (including all four categories) is 5.6%. The NNT for the Alberta series is then derived by taking the reciprocal of the ARRP:
![]()
TABLE 16.3. Efficacy and Effectiveness Results from All Categories and Studies | |||||||||||||||||||||||||||||||||||||||||||||||||||||||
|---|---|---|---|---|---|---|---|---|---|---|---|---|---|---|---|---|---|---|---|---|---|---|---|---|---|---|---|---|---|---|---|---|---|---|---|---|---|---|---|---|---|---|---|---|---|---|---|---|---|---|---|---|---|---|---|
| |||||||||||||||||||||||||||||||||||||||||||||||||||||||
P.307
Therefore, the estimated effectiveness of CE in the Alberta series can be expressed as an NNT of 17.9, meaning that one stroke was prevented in Alberta over 2 years for approximately every 18 CEs performed. Similar calculations a recent Ohio47 series of CEs extrapolating the proportions stenosis categories from the Alberta series produced an NNT of about 19. The AARs and NNTs for each category in the two series are shown with the efficacy results from RCTs for comparison in Table 16.3. Table 16.3 shows that the benefit (effectiveness) of operating on patients with asymptomatic carotid stenosis of >60% is extremely small, even in ACAS (AAR = 1.5%, NNT = 67).46 It is worse the Ohio series (ARR = 1.3%, NNT = 77) and is non-existent in the Alberta series (AAR -1.3%, NNH = 77). In fact, in the Alberta series, the NNT is really an NNH, a number needed to harm, because the perioperative stroke/death rate was greater than in ACAS by an amount exceeding the AAR in ACAS. Operating on a sizable proportion of asymptomatic patients, even with a reasonable complication rate, reduces the overall effectiveness of a series cases CE.
This is illustrated by considering the result in a recent audit of CE cases Calgary from 1994 to 199848 (see Table 16.3). The charts of 184 consecutive CE cases were reviewed, and 78% were symptomatic 22% asymptomatic cases. The perioperative stroke/death rate was 3.6% in the symptomatic cases. However, the rate in the asymptomatic cases was 12.7%, much higher than that in the ACAS trial.20 Despite this deficiency, which in that category resulted in an
P.308
NNH of 11, the overall effectiveness of CE in this series was an NNT of 11.5 (ARR = 8.7%), largely due to the preponderance of symptomatic cases. The surgeons were operating on a higher proportion of patients where there was more to gain, namely symptomatic cases. Thus, it is possible for surgeons with higher complication rates to have greater overall effectiveness than those with lower complication rates if they choose to operate mainly on symptomatic patients. This is not to suggest that reducing the perioperative stroke and death rate is not an important way of improving effectiveness. Surgery performed with the lowest possible complication rate is extremely important, and some have suggested that those with higher complication rates should not be performing CE.49 Nevertheless, the case mix will usually be a more important variable in determining overall effectiveness of a series CE cases.
It is possible to model the relationship between efficacy and case mix for CE. Figure 16.1 which demonstrates the effect of case mix on the ARR and NNT for CE. The efficacy figures are taken from the NASCET and ACAS trials. A series with 100% symptomatic cases will have an ARR of 13.1% and an NNT of 7.6 patients over two years as did NASCET, whereas one with 100% asymptomatic cases will have an ARR of 1.5% and an NNT of 67 patients. As the proportion
P.309
of asymptomatic cases increases, the efficacy declines. A similar relationship would apply to effectiveness in series of CE cases, measured J:o adjust from efficacy to effectiveness according differences in the perioperative stroke/death rate between the case series and the RCTs, as in the method described above.
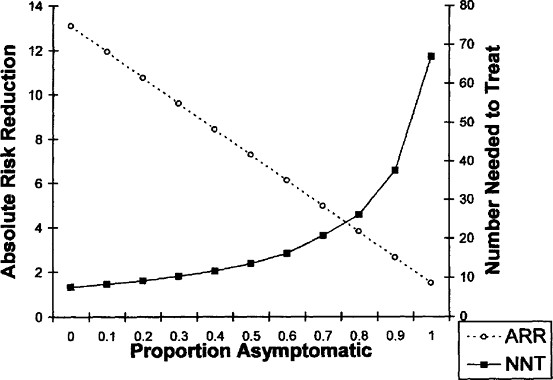 |
FIGURE 16.1. Model of the relationship between efficacy and case mix (proportion cases that are asymptomatic) for carotid endarterectomy. Efficacy figures are from the NASCET (ref. 19) and ACAS (ref. 20) trials. The number needed to treat (NNT) and the absolute risk reduction (ARR) are for two years. |
How does the effectiveness of CE compare with that other stroke prevention interventions? Although they require long-term treatment, antiplatelet agents and anticoagulation for atrial fibrillation would appear to be much less cumbersome approaches, but are they more effective? Unfortunately, only efficacy data are available. For anticoagulation for patients with atrial fibrillation, the NNT to prevent one stroke over two years is 16.50 For aspirin, the most widely used stroke prevention medication, 50 TIA patients must be treated for one year to prevent one stroke.51 Clopidogrel is a new antiplatelet drug introduced to treat TIAs. However, only a marginal benefit ensues from using clopidogrel, rather than aspirin, requiring 196 patients to be treated over one year prevent more stroke than is prevented by aspirin treatment.44 Almost certainly, the effectiveness of each of these prophylactic interventions is less than these efficacy figures, even in just the treated populations. The true effectiveness of these treatments must be measured to determine the quality of stroke prevention approaches. This is essential to enable a reduction in the incidence of stroke and to reduce its burden on society.
Conclusion
Quality problems, including overuse, underuse, and misuse, are widespread in clinical medicine. Both process and outcome measures are useful in detecting problems with quality. Appropriateness is the process measure most frequently applied to CE. It is very sensitive the criteria used determine appropriateness, and thus may vary widely between different studies. A more direct approach to measuring effectiveness has the advantage of incorporating both the adverse and good outcomes expected from an intervention such as CE. This may allow surgeons, hospitals, health regions, and health plans to monitor the benefit of their treatment interventions.
References
1. Chassin MR. Is health care ready for six sigma quality? The Milbank Quarterly 1998; 76:565 591.
2. Chassin MR, Galvin RW, and the National Roundtable on Health Care Quality. The urgent need to improve health care quality. JAMA 1998;280:1000 1005.
3. Hannan EL, Kilburn H, Racz M, et al. Improving the outcomes of coronary artery bypass surgery in New York State. JAMA 1994;271:761 766.
4. Epstein A. Performance reports on quality prototypes, problems, and prospects. New Engl J Med 1995;333:57 61.
P.310
5. Brook RH, McGlynn EA, Cleary PC. Measuring quality of care: Part 2. New Engl J Med 1996;335:966 970.
6. Lohr KN, ed. Medicare: A Strategy for Quality Assurance. Washington, DC: National Academy Press, 1990.
7. Gonzales R, Steiner JF, Sande MA. Antibiotic prescribing for adults with colds, upper respiratory tract infections, and bronchitis by ambulatory care physicians. JAMA 1997;278:901 904.
8. Soumerai SB, McLaughlin TJ, Speigelman D, et al. Adverse outcomes of underuse of /3-blockers in elderly survivors of acute myocardial infarction. JAMA 1997;277: 115 121.
9. Kahn KL, Rogers WH, Rubenstein LW, et al. Measuring quality of care with explicit process criteria before and after implementation of the DRG-based prospective payment system. JAMA 1990;264:1969 1973.
10. Bates DW, Spell N, Cullen DJ, et al. The costs of adverse drug events in hospitalized patients. JAMA 1997;277:307 311.
11. Donabedian A. Explorations in Quality Assessment and Monitoring. Vol. 1: The Definition of Quality and Approaches to Its Assessment. Ann Arbor, MI: Health Administration Press, 1980.
12. Green J, Wintfeld N. Report cards on cardiac surgeons: Assessing New York State's approach. New Engl J Med 1995;332:1229 1232.
13. Naylor CD. Assessing processes and outcomes of medical care. Ann Roy Coll Phys Surg Canada 1997;30:157 161.
14. Brook RH, Chassin M, Fink A, et al. A method for the detailed assessment of the appropriateness of medical technologies. Int J Technol Assess Health Care 1986;2:53 63.
15. Brook RH, Lohr KN. Efficacy, effectiveness, variations, and quality: Boundary-crossing research. Med Care 1985;23:710 722.
16. Winslow C, Solomon D, Chassin M, Kosecoff J, Merrick N, Brook RH. The appropriateness of carotid endarterectomy. New Engl J Med 1988;318:721 727.
17. Chassin MR, Brook RH, Park RE, et al. Variations in the use of medical and surgical services by the Medicare population. New Engl J Med 1986;314:285 290.
18. North American Symptomatic Carotid Endarterectomy Trial Collaborators. Beneficial effect of carotid endarterectomy in symptomatic patients with high-grade stenosis. New Engl J Med 1991;325:445 453.
19. Barnett HIM, et al. The benefit of carotid endarterectomy in symptomatic patients with moderate and severe stenosis. New EnglJ Med 1998;339:1415 1425.
20. Executive Committee for the Asymptomatic Carotid Atherosclerosis Study. Endarterectomy for asymptomatic carotid artery stenosis. JAMA 1995;273:1421 1428.
21. Wong J, Findlay Suarez-Almazor M. Regional performance of carotid endarterectomy: Appropriateness, outcomes and risk factors for complications. Stroke 1997;228: 891 898.
22. Moore WS, Barnett HIM, Beebe HG, et al. Guidelines for carotid endarterectomy: a multi-disciplinary consensus statement from the Ad Hoc Committee, American Heart Association. Stroke 1995;26:188 201.
23. Findlay JM, Tucker WS, Ferguson GG, et al. Guidelines for the use of carotid endarterectomy: Current recommendations from the Canadian Neurosurgical Society. Can MedAssoc J 1997;157:653 659.
24. Wong J, Lubkey T, Suarez-Almazor M, Findlay JM. Improving the appropriateness of carotid endarterectomy: Results of a prospective city-wide study. Stroke 1999;30: 12 15.
P.311
25. Karp HR, Flanders D, Shipp CC, et al. Carotid endarterectomy among Medicare beneficiaries: A statewide evaluation of appropriateness and outcome. Stroke 1998;29: 46 52.
26. Bratzler DW, Oehlert W, Murray C, et al. Carotid endarterectomy in Oklahoma Medicare beneficiaries: Patient characteristics and outcomes. J Okla St Med Assoc. 1996;89:423 429.
27. Winslow CM, Kosecoff J, Chassin M, Kanouse D, Brook RH. The appropriateness of performing coronary artery bypass surgery. JAMA 1988;260:505 509.
28. Leape LL, Hilborae L, Schwartz J, Bates D, et al. The appropriateness of coronary artery bypass graft surgery in academic medical centers. Ann IntMed 1996;125;8 18.
29. Fox GA, O'Dea J, Parfrey PS. Coronary artery bypass graft surgery in Newfoundland and Labrador. Can Med Assoc J 1998;158:1137 1142.
30. Naylor CD. What is appropriate care? New Engl J Med 1998;338:1918 1920.
31. Shekelle PG, Kahan J, Bernstein S, et al. The reproducibility of a method to identify the overuse and underuse of medical procedures. New Engl J Med 1998;338:1888 1895.
32. Kahan JP, Park RE, Leape LL, et al. Variations by specialty in physician ratings of the appropriateness and necessity of indications for procedures. Med Care 1996; 34:512 523.
33. Wells KB. Treatment research at the crossroads: The scientific interface of clinical trials and effectiveness research. Am J Psychiatr 1999(Jan);156:5 10.
34. The Norwegian Multicenter Study Group. Timolol-induced reduction in mortality and reinfarction in patients surviving acute myocardial infarction. New EnglJ Med 1981; 304:801 807.
35. /3-B locker Heart Attack Trial Research Group. A randomized trial of propranolol in patients with acute myocardial infarction. 1. Mortality results. JAMA 1982;247:1707 1714.
36. Schuster M, McGlynn E, Brook R. How good is the quality of health care in the United States? The Milbank Quarterly 1998;76:517 563.
37. Udvarhelyi I, Jennison K, Phillips R, Epstein A. Comparison of the quality ambulatory care for fee-for-service and prepaid patients. Ann Int Med 1991; 115:394 400.
38. Brass L, Krumholz H, Scinto J, Mathur D, Radford M. Warfarin use following ischemic stroke among Medicare patients with atrial fibrillation. Arch Intern Med 1998; 158:2093 2100.
39. Feasby TE. Measuring the effectiveness of carotid endarterectomy 2001, submitted for publication
40. Sackett DL, Haynes RB, Guyatt GH, Tugwell P. Clinical Epidemiology. A Basic Science for Clinical Medicine. Boston: Little, Brown & Co, 1991.
41. Sinclair JC, Bracken MB. Clinically useful measures of effect in binary analyses randomized trials. J Clin Epidemiol 1994;47:881 889.
42. McQuay HJ, Moore, RA. Using numerical results from systematic reviews in clinical practice. Ann Int Med 1997;126:712 720.
43. Laupacis A, Sackett DL, Roberts RS. An assessment of clinically useful measures of the consequences of treatment. New Engl J Med 1988;318:1728 1733.
44. CAPRIE Steering committee. Randomized blinded trial of clopidogrel versus aspirin in patients at risk of ischemic events. Lancet 1996;348:1329 1339.
45. European Carotid Surgery Trialists' Collaborative Group. Randomized trial of endarterectomy for recently symptomatic carotid stenosis: Final results of the MRC European Carotid Surgery Trial (ECST). Lancet 1998;351:1379 1287.
P.312
46. Barnett HIM, Eliaziw M, Meldrum H, Taylor D. Do the facts and figures warrant a 10-fold increase in the performance of carotid endarterectomy on asymptomatic patients? Neurology 1996;46:603 608.
47. Cebul RD, Snow JR, Pine R, et al. Indications, outcomes, and provider volumes for carotid endarterectomy. JAMA 1998;279:1282 1287.
48. Janes E, Ghali W, Karbalai H, Feasby TE, Buchan AM. The risks of inappropriate carotid endarterectomy. Ann Neurol 1998;44:510.
49. Goldstein LB, Moore WS, Robertson JT, Chaturvedi S. Complication rates for carotid endarterectomy: A call to action. Stroke 1997;28:889 890.
50. Atrial Fibrillation Investigators. Risk factors of stroke and efficacy of anti-thrombotic therapy in atrial fibrillation: Analysis of pooled data from five randomized, controlled trials. Arch Int Med 1994; 154:1449 1457.
51. Antiplatelet Trialists' Collaboration. Collaborative overview of randomized trials antiplatelet therapy: Prevention of death, myocardial infarction, and stroke by prolonged antiplatelet therapy in various categories of patients. BMJ 1994;308:81 106.
EAN: 2147483647
Pages: 23
- Integration Strategies and Tactics for Information Technology Governance
- Assessing Business-IT Alignment Maturity
- Technical Issues Related to IT Governance Tactics: Product Metrics, Measurements and Process Control
- Governance in IT Outsourcing Partnerships
- Governance Structures for IT in the Health Care Industry