Section 4.4. Interference to Cellular Systems
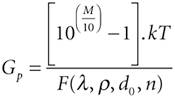
4.4. Interference to Cellular SystemsIn this section, we discuss UWB interference to CDMA-based cellular systems. The discussion is based on calculating the maximum UWB PSD that degrades the performance of a cellular receiver by M dB. Equation 4-14 defines the amount of UWB PSD, Gp, that increases the victim receiver's noise power by a margin of M dB. Equation 4-14
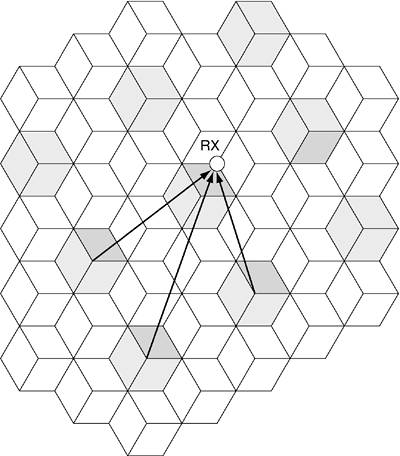
where M denotes the amount of SNR degradation in dB, k is the Boltzmann constant, T is the temperature in Kelvin, and the denominator represents the cumulative interference from multiple UWB sources. The derivation of this equation is available in Appendix A. The interference analysis starts with the case of a cellular receiver operating in a noise-limited environment. Therefore, we have considered the impact of the interference of UWB transmitters to the receiver noise power. Noise-limited cellular systems are generally found in areas with low user density, such as rural areas. Equation 4-14 could be used to estimate the maximum UWB PSD that would shrink the link budget of cells of such a cellular system by M dB. Cellular networks that are deployed in areas with high user density, such as urban areas, are generally interference-limited and require an alternative to Equation 4-14 for determining the maximum UWB PSD. In this case, a cellular receiver is subject to co-channel interference from the cellular system itself, in addition to the interference from UWB transmitters (see Figure 4-26). Figure 4-26. Co-channel interference in cellular systems
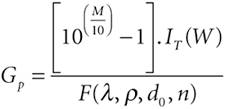
Considering the co-channel interference in a cellular system, the UWB interference has to be greater than the cellular interference to have a detrimental effect on the cellular system performance. A similar equation to Equation 4-14 can easily be derived for the Gp that increases the receiver's co-channel interference plus noise power by M dB. (Refer to Appendix A for derivation of this equation.) Equation 4-15
where IT is the cellular interference power at the victim receiver; IT consists of cellular interference power at the victim receiver, I0; plus the receiver noise power, N0, in watts: Equation 4-16
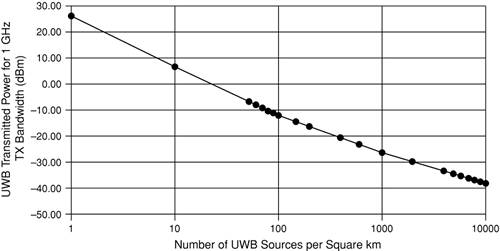
Having derived expressions for the maximum UWB PSD that degrades the performance of a cellular receiver by M dB for both rural and urban areas, we will determine typical maximum UWB PSD values for cellular systems in the following subsections. 4.4.1. Interference to Rural CDMA-Based Cellular SystemsBefore presenting the main results based on the equations in the previous section, let us first show the variation of the maximum UWB transmitted power as a function of UWB density, assuming a 1 GHz transmission bandwidth. The graphs in this section show the maximum UWB transmitter, TX, power that increases the noise floor of a noise-limited cellular system by 1 dB (that is, M has been set to 1 dB). The noise figure is assumed to be 6 dB in the following graphs. The propagation model used is free space up to a distance d0; beyond that distance, a fourth-order power law is used. In the following example, we assume a distance d0 of 100 meters. As shown in Figure 4-27, with an increase in the UWB transmitter density, the maximum UWB transmitted power decreases, as one would expect. Figure 4-27. Graph of the maximum UWB transmitted power for a 1 GHz transmission bandwidth plotted against the density of UWB sources for a 1 dB degradation
The slope of the graph changes just beyond a density of 50 UWB sources per square kilometer. This is the point at which some UWB transmitters begin to be within free-space transmission range of the cellular receiver. The density of UWB sources when this occurs is
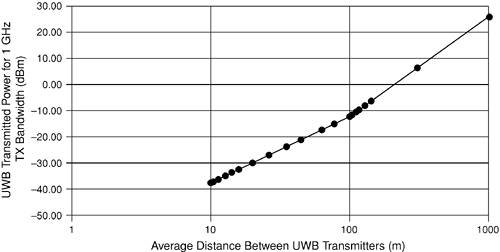
which is 5 x 10⁵ per square meter (that is, 50 per square kilometer). To understand why the slope of the graph in Figure 4-27 decreases beyond a density of 50 UWB sources per square kilometer, consider the graph in Figure 4-28, which shows the UWB transmitted power plotted as a function of the average distance between UWB transmitters, R0. The change in slope occurs when R0 reaches a value of
Figure 4-28. Graph of the UWB transmitted power for a 1 GHz transmission bandwidth plotted against the average distance between UWB sources (1dB degradation)
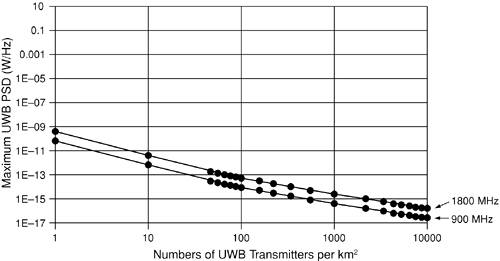
which is 141 meters. For UWB transmitters spaced less than 141 meters apart, the power received by the cellular receiver is due to free-space transmission, whereas beyond 141 meters, the power received from all the UWB transmitters is determined by the fourth-order power law. As shown in Figure 4-28, increasing the average UWB separation from 10 meters increases the maximum UWB transmission power at more than 20 dB per decade until a separation distance of 141 meters. Beyond 141 meters, the maximum UWB transmission power increases much more steeply, at approximately 40 dB per decade. In this region, the UWB transmission power can be increased at a faster rate compared to the region below 141 meters because the received power at the cellular receiver decreases at a faster rate (that is, according to the fourth-order power law). On the other hand, for UWB separations below 141 meters, some of the UWB sources are within the free-space transmission range. Therefore, as the UWB separation increases, the received power at the cellular receiver decreases at a slower rate. 4.4.2. Interference to Urban CDMA-Based Cellular SystemsIn this section, we consider the maximum allowed PSDs of UWBs in an urban area, where the system is not noise limited anymore. To appropriately model the radio propagation in urban areas from the UWB transmitters to a CDMA base station, free-space propagation is assumed up to 100 meters from the UWB transmitters, and then an inverse fourth-power law with distance is used (that is, d0 is 100 meters and n is 4 in our propagation model). This is done because large urban cells have harsher propagation characteristics than large rural cells. The worst-case scenario would be for the UWB transmissions to come from mobile handsets, assuming that the number of active mobiles is greater than the number of base stations. The graph in Figure 4-29 shows the maximum UWB PSD that increases the noise floor of the cellular system by 1 dB. Two plots are shown, for cellular receivers that operate at frequencies of 900 MHz and 1800 MHz. The cellular system is assumed to be IS-95 CDMA. Figure 4-29. Graph of the maximum UWB PSD plotted against the density of UWB transmitters. The maximum UWB PSDs were calculated based on the interference that would be caused on an urban CDMA system for a 1 dB degradation. Two plots are shown, one assuming that the victim cellular receiver operates at 900 MHz and the other for a cellular receiver operating at 1800 MHz.
The graph in Figure 4-30 shows the maximum UWB transmitted power for a variety of UWB transmission bandwidths. Figure 4-30. Graph of the maximum UWB transmitted power for a variety of transmission bandwidths. The victim cellular receiver has an operating frequency of 900 MHz and is part of an urban CDMA cellular system.
Assuming that the UWB system is a cellularlike system, we would expect perhaps a maximum of 100 active users per square kilometer, whichfom the graphs in Figure 4-28 for UWB transmitters of 1 GHz bandwidthallows a maximum UWB transmitter power of about 20 dBm. The maximum UWB transmit power that increases the noise floor by only 1 dB for an IS-95 CDMA system would be the same as for a third-generation (3G) CDMA system, because the receiver bandwidth does not affect the maximum allowed UWB transmission power. |

EAN: 2147483647
Pages: 93