Monitoring and Tuning Utilities
| | ||
| | ||
| | ||
Monitoring the OC4J instance and its processes and applications is an important administrative task that's useful for both troubleshooting errors and performance tuning. While there are many well-known operating-system and database utilities that can help tune or troubleshoot an application, some of the best and newest are within the 10g AS product suite itself. These are the ASC logging utilities, AggreSpy, and the iHAT tool.
Application Server Control Log Utilities
Although there are multiple log files that can be manually reviewed on the file system, the ASC provides a good interface into these logs. At the bottom of any OC4J administration screen, you'll see a Logs link. That link takes you to the View Logs page shown in Figure 17-14.
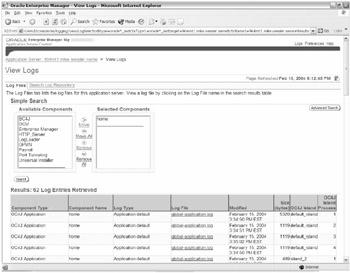
Figure 17-14: View Logs page
The View Logs page allows you to configure which components ' logs within the mid- tier instance to view. Options aren't just limited to OC4J components; rather, components such as OHS, OUI, and Distributed Configuration Management (DCM) are available. In this example we've only selected the OC4J home instance logs.
Each OC4J instance process within an island has its own set of log files. With two islands of three and four processes each and multiple logs for each deployed application, the number of log files can increase quickly. Fortunately, each log file is labeled with name , modified date, size , and the OC4J island process it belongs to. The following are the types of visible logs that are maintained :
-
global-application.log
-
application.log
-
jms.log
-
server.log
-
redirected output/errors
-
default-web-access.log
Clicking any log brings up the first 2,000 lines of the log file along with the path to the file in case you want to manually view it on the file system. Although it's good to see the entire log file, this is cumbersome if multiple files need to be reviewed or if those files are very large. To alleviate this problem, the ASC provides a repository, managed by LogLoader, of log-files messages that can be queried by component type, message type, time of the event, and even text strings (using Regular Expressions). You access this tool by clicking Search Log Repository, as shown in Figure 17-15.
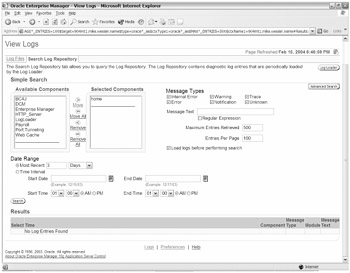
Figure 17-15: Search Log Repository page
Even more advanced searches can be executed with the Advanced Search link. This allows more advanced querying for strings within the log files.
LogLoader is a process that loads log files into its repository and performs searches. It's managed from the LogLoader administration page shown in Figure 17-16.
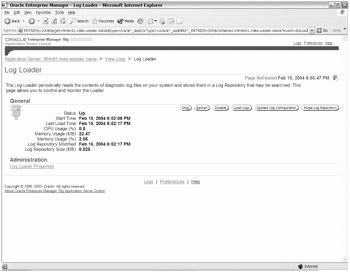
Figure 17-16: LogLoader administration page
From within this page you can start and stop LogLoader and load or purge logs within the repository. You can modify storage characteristics of the log repository by clicking the LogLoader Properties link. Within that page you can define the location of the repository, its maximum size (default 50 MB), and how often log entries are loaded into the repository (default every five minutes).
AggreSpy and Dmstool
AggreSpy is a web-based tool that displays metrics for OC4J and OHS components. Metrics are gathered by Dynamic Monitoring Service (DMS) and can be viewed at http://mike.wessler.name:7777/j2ee/servlet/AggreSpy , as shown in Figure 17-17.
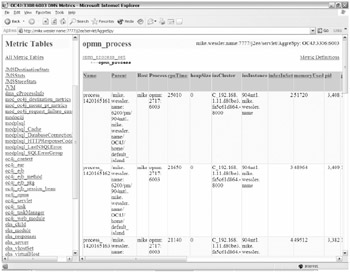
Figure 17-17: AggreSpy home page
Metrics and error messages for components within OHS, OPMN, OC4J, JMS, and mod_plsql are available. Information typically displayed includes process name, parent, PID, number of active connections, average service time, and error messages. These are broken into 44 metrics tables in the left frame so you should review them yourself to determine which ones are most useful for your environment. We've found JVM, ohs_responses, oc4j_servlet, mod_oc4j_request_failure_causes, ohs_module , and modplsql_HTTPResponseCodes to be most useful, although we encourage you to review them all initially.
In Figure 17-18 you can see a sample of the kind of metrics made available by AggreSpy.
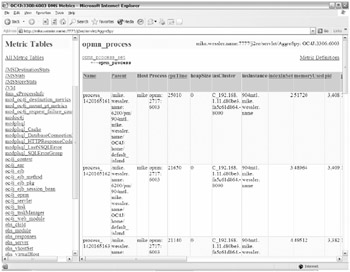
Figure 17-18: AggreSpy opmn_process metrics page
Figure 17-18 shows the opmn_process table showing each OPMN process, its memory size in detail, accumulated CPU time, and other statistics. Many of the heading titles are sometimes terse, but at the top and bottom of each table is a Metric Definitions link. This link provides useful heading descriptions and units of measure for each corresponding table.
The alternative to AggreSpy is the dmstool . It's a command-line utility that's located in $ORACLE_HOME/bin and can be used to get similar metrics. Use dmstool -list to get a listing of what metrics can be captured, and dmstool -table to get the metrics, but be forewarned: The output can be large.
iHAT (Hi-AV) Tool
Oracle offers the iHat High Availability (Hi-AV) Tool as an additional way to monitor components within 10g AS. iHat is a graphical tool that displays each component that's managed by OPMN and performance metrics for each process. The DMS is the process that provides the metrics to the tool. Originally available with 9iAS v2, the tool is downloaded and installed separately from the Oracle Technology Network (OTN). You can find it at http://otn.oracle.com/products/ias/ias_utilities.html .
A readme.html file comes with the product and the installation steps are simple. The list shows you how to run the tool from the localhost via X Windows.
-
Set your DISPLAY to run X Windows from the localhost, as shown here:
$ export DISPLAY=:0.0
-
Confirm that you're using Java 1.4.1 or higher, as follows :
$ java -version java version "1.4.2-rc1" Java(TM) 2 Runtime Environment, Standard Edition (build Blackdown-1.4.2-rc1) Java HotSpot(TM) Client VM (build Blackdown-1.4.2-rc1, mixed mode) $
-
Create a directory in $ORACLE_BASE for the iHat files, as shown here:
$ cd $ORACLE_BASE $ mkdir ihat
-
Send the ihat.zip file to the ihat directory via binary FTP. Then unzip the file, as shown here:
$ unzip ihat.zip Archive: ihat.zip inflating: ihat.jar inflating: README.html $
-
Identify the port that OPMN is listening on by searching opmn.xml located in $ORACLE_HOME/opmn/conf . This port number will be used when starting the tool, as follows:
$ grep '<port.*request' opmn.xml <port local="6100" remote="6200" request="6003"/> $
-
Start the iHat tool using the value for the request port ( 6003 ), as follows:
$ java -jar ihat.jar localhost:6003
At this point an X Window will appear. It shows all the OPMN components, as you can see in Figure 17-19.
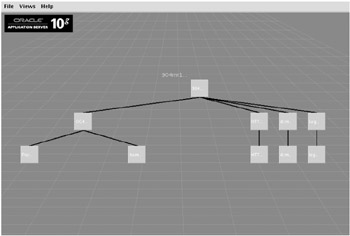
Figure 17-19: iHat Grid View page
The Grid View page shows the mid-tier instance composed of the OC4J instance, HTTP_Server, dcm-daemon , and LogLoader.
To get a better view of how URL requests are sent to the various OC4J instances, select Views Routing View. This view also shows the number of requests to each OC4J island, the PID of the process, and the requests per second.
For detailed information regarding CPU, memory, and the PID for each component, right-click the Grid View page, which will bring up the Instance View page shown in Figure 17-20.
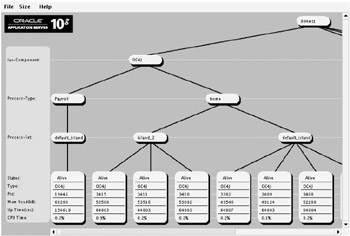
Figure 17-20: iHat Instance View page
This page shows a hierarchal diagram of each component OC4J on the left with HTTP_Server, dcm-daemon , and LogLoader on the right. Component status, type, PID, memory and CPU utilization, and time running are displayed for each. Right-clicking each individual component will bring up additional options to view the DMS Requester, Servlet Tables, and JMS Viewers. Options to stop, start, and restart entire components are available by right-clicking the top-level components such as Process-Set, Process-Type , or Ias-Component .
iHat is a good tool to use to view your hierarchy of processes and see which ones are using the most resources. Since it does have the capability to shut down your processes and does consume OS resources, we generally leave it shutdown except for when we're using it.
| | ||
| | ||
| | ||
EAN: 2147483647
Pages: 150