A.10 Object Life Cycle
| only for RuBoard - do not distribute or recompile |
A.10 Object Life Cycle
In this section, I provide a few clues into the temporal characteristics of web objects. By analyzing Squid's store.log files, we can see how old an object is when it enters the cache, when it was last modified, and when it expires .
Age, expiration, and modification time calculations depend on the presence of certain HTTP headers. The Date header is quite common, but the Expires header is rare. If a header is missing or invalid, the response is not included in the analysis.
Figure A-10. Distribution of object ages, modification, and expiration times (IRCache data)
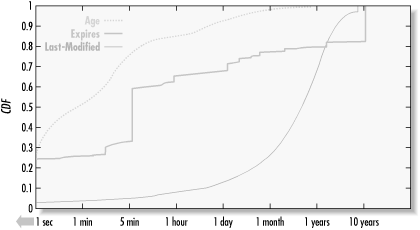
In Figure A-10, you'll see cumulative distribution (CDF) plots for object age, time since modification, and time until expiration. Age values are taken from the HTTP Age header or, in most cases, by subtracting the Date header value from the current time. Whenever a cache receives a response from an origin server, the object's age should be zero. However, the age may be nonzero for one or more of the following reasons:
-
The origin server's clock may be wrong. Even if the response is generated at the current time, the server's Date header may be in the future or the past by a significant amount. In this analysis, negative age values are discarded.
-
The response may have been served from a neighbor cache rather than the origin server. Most IRCache proxies have neighbors, so it's likely that about 5% of requests are found in those neighbors.
-
The origin server may actually be a surrogate. The Akamai content distribution network falls into this category. When you request an object such as http://a1.g.a.yimg.com/7/1/31/000/us.yimg.com/i/mail/mailicon.gif , you receive a cached response, and the Date header is set to a specific time in the past.
Table A-12 shows the same data in tabular form. You can see, for example, that 28% of responses with valid Date or Age headers are less than 1 second old, and 94% are less than 1 day old.
Table A-12. Object Life Cycle Percentiles
| Time | Age percentile | Expiration percentile | LMT percentile |
|---|---|---|---|
| 1 second | 28 | 25 | 4 |
| 1 minute | 62 | 31 | 5 |
| 1 hour | 86 | 66 | 9 |
| 1 day | 94 | 73 | 15 |
| 1 week | 98 | 78 | 24 |
| 1 month | 99 | 80 | 39 |
| 1 year | 100 | 83 | 86 |
| 1 decade | 100 | 100 | 100 |
The distribution of expiration times is particularly interesting. Unlike the others, it is not very smooth. The vertical increases correspond to spikes in the histogram. For example, there is a sudden increase from 30% to 60% right at the 5-minute mark. This means that, of the responses with an expiration time, 30% were set to expire after 5 minutes. You can also see "spikes" at 1 minute, 1 hour, 1 day, 1 month, and 1 year.
The Last-modified distribution is shifted farther to the right, indicating that the time since modification is relatively large. As Table A-12 shows, of the responses entering the cache that have the Last-modified header, 60% have not changed in the previous month. In fact, 47% of those responses have a last modification time between 1 month and 1 year ago.
| only for RuBoard - do not distribute or recompile |