22.2. HP Troubleshooting Methodology
| < Day Day Up > |
| The high degree of interaction between the server system, options hardware, operating system, and application software can make it difficult to isolate the root cause of a problem. Intermittent problems and problems generated by multiple subsystem malfunctions can be especially difficult to troubleshoot. HP has developed a six-step troubleshooting methodology, shown in Figure 22-1, to systematically get to the core of a problem, resolve it, and take steps to limit the possibility of it happening again. These six steps are as follows:
Figure 22-1. HP troubleshooting methodology flowchart.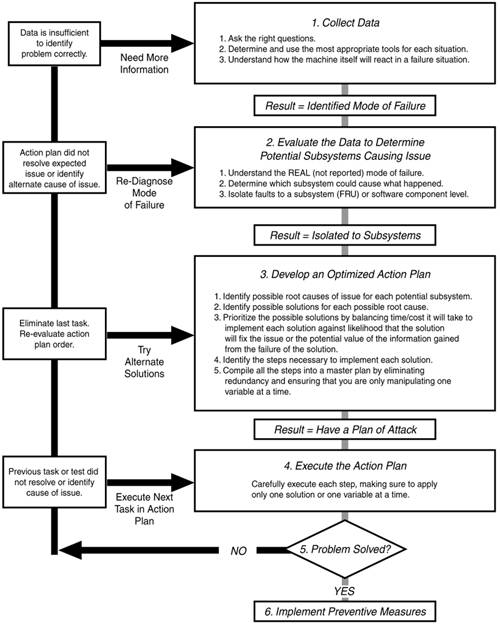 As part of any change management process, altering only one variable at a time can show the impact of that change. If manipulating one variable does not result in any performance increase, revisiting the data to determine the next variable to manipulate is the next step. By following the HP troubleshooting methodology, you can use a standard approach to reduce possibilities until a solution set is found. This methodology provides a logical framework to troubleshoot system problems and reach problem resolution. A logical framework also provides a consistent and solid foundation for other technicians and system engineers to work from when escalation is necessary. 22.2.1 Troubleshooting Step 1 Collect DataThe first step in troubleshooting a problem involves spending the time and effort to gather helpful information. There are actually two skills involved in this step: (1) asking the right questions, and (2) using the appropriate tools and methods to gather and analyze system data. 22.2.1.1 ASKING THE RIGHT QUESTIONSAs you begin the troubleshooting process, start by asking a series of questions that will help you thoroughly understand the nature of the problem. Here are some of the questions you could ask:
Through experience and logic, the answers to these kinds of questions will help you narrow down the possible causes and will help you focus your efforts as you begin collecting additional data on your own. 22.2.1.2 COLLECTING SYSTEM DATAAfter you have determined the answers to the general questions, you now begin the process of collecting very specific information about the system. The specific data information you collect should include each of the following items:
HP provides several tools for viewing system data. Some of these utilities are integrated into the server itself, but all complement each other. These utilities include the following:
Each of these utilities is described briefly later in this chapter. 22.2.1.3 SETTING A PERFORMANCE BASELINE FOR WINDOWS SYSTEMSAs part of the information gathering process, you establish a performance baseline. ! Important This should be done before any changes are made to a system. Windows Server 2003 (and earlier versions) includes a useful utility called Performance. This utility is located under the Administrative Tools icon in the Control Panel. It is used to monitor either local or remote system performance. After the needed counters are chosen, Performance can track and record them. This is useful for real-time monitoring and logging for a baseline. Over time, this data can help identify system bottlenecks. After the tool is started, you can add various counters to the System Monitor feature to track performance of a local or remote computer. You can choose related counters and specific instances from several performance object categories. Specific instances refer to the ability to choose all or specific processors or page files. (Not all counters have instances to choose from.) Although some of the counters represent averages for read/write requests, separate counters for read and write operations can be used to gain a more specific view of activity instead. Note To get an explanation of each counter, click Explain from the Add Counters window after clicking the plus sign (+) icon in System Monitor. Some counters have different scales, so it is important that the scale of one counter does not affect the readability of the other counters. Counter scales can be adjusted by right-clicking the counter in the legend area at the bottom of the Performance windows and selecting Properties, and then Data. On this tab in the System Monitor Properties window, you can adjust the color, scale, width, and style of each counter. Other tabs enable you to adjust the properties of source, graphs, colors, and fonts. A Web browser provides a convenient way to monitor these counters. After the counters are selected and optimized for readability, they can be saved as an HTML-format file by right-clicking the graph. The file can then be opened in a browser on any computer. 22.2.2 Troubleshooting Step 2 Evaluating and Interpreting the DataAfter you have gathered the data, the next step is to evaluate and interpret the data to determine which subsystem or subsystems could be causing the problem. The evaluation and interpretation of the data enables you to do the following:
After you have determined what is most likely causing the problem to occur, you are ready to move to Step 3. 22.2.3 Troubleshooting Step 3 Develop an Optimized Action PlanAfter collecting the facts and isolating the specific mode of failure, your next step in the troubleshooting process is to develop an optimized action plan. The action plan is developed through the following steps:
22.2.4 Troubleshooting Step 4 Execute the Action PlanIn Step 4, you implement the optimized action plan you created in Step 3. It is critical that you carefully observe and record the results of each step. Even if the action plan does not solve the problem, it might provide more clues to solving it. To execute the action plan, you carefully execute each step, implementing only one solution (that is, modifying only one variable) at a time. As you implement each step, observe and record the results of each step, including any error messages or changes in functionality. 22.2.5 Troubleshooting Step 5 Determine Whether the Problem Is SolvedStep 5 is to evaluate the results of each step until the problem has been isolated and resolved. If the problem is not resolved, you cycle back through the troubleshooting methodology by doing the following:
22.2.6 Troubleshooting Step 6 Implement Preventive MeasuresAs soon as the problem is resolved, you implement the necessary preventive measures that will ensure that the problem is not repeated (if possible). You should also look at opportunities to improve or increase system availability. To implement preventive measures, follow these steps:
The HP troubleshooting methodology provides you with a structured approach to solving problems in an efficient manner. |
| < Day Day Up > |
EAN: 2147483647
Pages: 278