In addition to the tools introduced in the previous sections, which have been available since the early days of Linux, there are several new programs that can be used to check and monitor networks. We will introduce three of these tools. Detailed information about these tools is found in the relevant manual pages or URLs.
bing is a tool to identify the bandwidth currently available between two computers. bing uses ICMP packets with different sizes and tries to work out the current bandwidth from identified packet round trips.
bing uses numerous options, which are described in the manual page (man bing). The following example shows how a 54-kbps modem line can be measured.
root@tux # bing 213.7.6.95 141.25.10.72 BING www.linux-netwerkarchitektur.de (213.7.6.95) and 1701d.tm.uka.de (141.25.10.72) 44 and 108 data bytes 1024 bits in 0.000ms 1024 bits in 20.123ms: 50887bps. 0.01965lms per bit 1024 bits in 10.103ms: 101356bps. 0.009866ms per bit 1024 bits in 10.138ms: 101006bps. 0.009900ms per bit 1024 bits in 10.557ms: 96997bps. 0.010310ms per bit 1024 bits in 19.966ms: 51287bps. 0.019498ms per bit 1024 bits in 19.174ms: 53406bps. 0.018725ms per bit 1024 bits in 19.314ms: 53019bps. 0.01886lms per bit 1024 bits in 19.510ms: 52486bps. 0.019053ms per bit -- 213.7.6.95 statistics -- bytes out in dup loss rtt (ms): min avg max 44 51 51 0% 0.049 0.053 0.078 108 51 51 0% 0.023 0.024 0.025 -- 141.25.10.72 statistics -- bytes out in dup loss rtt (ms): min avg max 44 51 50 1% 99.644 112.260 147.178 108 50 50 0% 119.154 127.578 199.999 -- estimated link characteristics -- warning: rtt big hostl 0.023ms < rtt small host2 0.049ms estimated throughput 52486bps minimum delay per packet 86.182ms (4523 bits) average statistics (experimental): packet loss: small 1%, big 0%, total 0% warning: rtt big hostl 0.024ms < rtt small host2 0.053ms average throughput 66849bps average delay per packet 98.793ms (5185 bits) weighted average throughput 66188bps
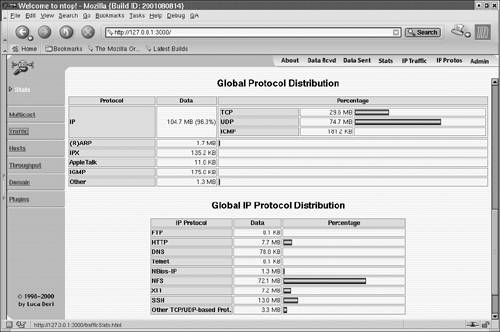
ntop shows information about the current utilization of connected networks. It logs all packets received over the network adapters and creates various statistics. Figure C-1 shows an example of the current distribution of the protocols used. We can see that ntop is browser-based (i.e., it represents its information in the form of Web pages). There is also a text-based version, which is similar to the top tool used to display current processes and their computing load.
Figure C-1. Using ntop to analyze the network traffic in local area networks.
Information about the use of ntop is available in the manual page or at http://www.ntop.org.
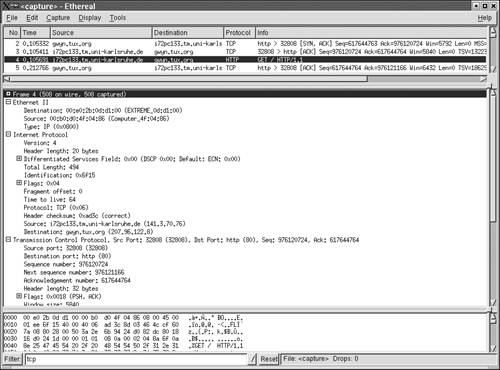
ethereal is another tool for studying the data traffic in local area networks. In contrast to ntop, which is more suitable for creating statistics and studying the load distribution in local area networks, ethereal is used for detailed analysis of certain data streams. It captures the current data streams in a local area network and interprets the packet contents or the relevant protocol processes. Figure C-2 shows an example of how ethereal captures an HTTP request to a Web server, http://www.tux.org.
Figure C-2. Using ethereal to analyze data streams.
Information about ethereal is available in the manual page (man ethereal) or at http://www.ethereal.com.