Section Q. Process Can t Make Product at All


Q. Process Can't Make Product at All

Overview

Sometimes (thankfully, very rarely) processes lose the capability to make product (in specification) at all. Every entity they generate is a defect or the process just cannot generate any entities. This might seem impossible to some but, working in multiple industries, I've seen more than a handful of these cases.

This Problem Category is probably least suited to Lean Sigma, but hopefully the roadmap shown might give some pointers to strengthen a better one out there.

Examples
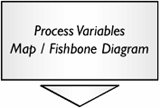
  • Industrial. Chemical plant yields fall to zero; all products generated are defective[11]

    [11] At one UK rubber company in 1995, I witnessed the making of 500 units to get enough good ones to meet an order for 30 units.

Measuring Performance

The performance characteristics on which the product specifications are based are the best measures here (e.g., if a specification for viscosity is being used to determine that the product is defective, use viscosity as the metric). These metrics tend to be continuous in nature and make excellent Ys for tool use. Statistical power will be lost if they are converted to an attribute measure of defectiveness (meeting specification or not). In Lean Sigma terms, we would have taken a useful performance metric and converted it into a not-so-useful conformance metric.

Tool Approach

The roadmap here is debatable. Time obviously plays a critical factor in any discussion here. This is usually an "all hands on deck" situation. The tools listed are rigorous, but might be perceived as not quick enoughI'm in complete agreement, but rushing to a solution often takes longer (more haste, less speed). The general path would be to assume that at some point in time the process was working and therefore something has changedin which case, the focus is to determine what did change.

If it is obvious what changed to cause the issue, skip the following steps and proceed to the * step later in this section. Otherwise, continue down this roadmap.

If one doesn't exist, quickly lay down a map of the process. This is just for the major steps in the process at this point. Don't detail out all the substeps.

Narrow down the point of failure in the process. This is done by tracking step by step through the process and determining whether the output at each step meets known requirements. The exact point might not be determined, but at least the section of the process in which the failure is occurring can be identified.

If it is now obvious what changed to cause the issue, skip the following steps and proceed to the * step later in this section. Otherwise, continue down this roadmap.


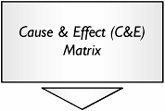
For the following steps, it is usually worthwhile having someone onsite at the process, checking on possibilities as they arise from the tools. Parallelism is good here.

Use both the Process Variables Map and Fishbone Diagram (to ensure nothing is missed) to identify all input variables (Xs) that cause changes in the Primary Performance Metric(s) (Ys) that are failing. Only map the section of process where the failures are occurring. Any obviously problematic uncontrolled Xs should be examined at the process site immediately.

The Xs generated by the Process Variable Map are transferred directly into the C&E Matrix. The Team uses its existing knowledge of the process through the matrix to eliminate the Xs that don't affect the Ys. There should not be many process steps involved, so a single-phase C&E should suffice.

Feed the results (narrowed-down list of Xs) of the C&E matrix to the onsite personnel to have them examined.

The reduced set of Xs from the C&E Matrix is entered into the FMEA. This tool will narrow them down further, along with generating a set of action items to eliminate or reduce high-risk process areas.


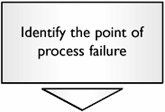
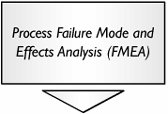
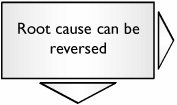
* At this point, the root cause of failure could be known or narrowed to a small number of possibilities that should be investigated quickly to determine which cause is most likely. After the root cause is known, the question would be "Can it be reversed?" with the following answers:

Change back immediately and then proceed to Control tools in Chapter 5 to prevent the change occurring in the future.

Change back as far as possible immediately. From this point forward, it might be possible to use the roadmap to enhance the performance characteristic shown in Section M in this chapter.


If you've come to this point, things don't look good. (Sorry!) There are limited options available, such as seeking a secondary supply, but really this will invoke a "back to the drawing board" approach. In this case, Design For Six Sigma[12] or Six Sigma Process Design[13] could play a significant role. Sincere good luck to you!

[12] See Commercializing Great Products with Design for Six Sigma by Randy Perry and David Bacon (Prentice Hall PTR, ISBN: 0132385996).

[13] No known published literature exists at the time of writing. See www.sbtionline.com for more details.


Lean Sigma(c) A Practitionaer's Guide
Lean Sigma: A Practitioners Guide
ISBN: 0132390787
EAN: 2147483647
Year: 2006
Pages: 138

flylib.com © 2008-2017.
If you may any questions please contact us: flylib@qtcs.net