Section 48. TimeProcess Lead Time
48. TimeProcess Lead TimeNoteAs with other definitions described in "TimeGlobal Process Cycle Time," "TimeIndividual Step Cycle Time," "TimeReplenishment Time," and "TimeTakt Time" in this chapter, there is disagreement between different Process Improvement camps. To be frank, it really doesn't matter which naming convention you select, as long as you measure the right thing from a project perspective and do the right things based on it. In the subsequent description, focus on what to measure, as opposed to what it's called. The naming convention used here is chosen for its clarity and practicality. If a (different) naming convention is already established in your business, then use that; however, a little digging usually uncovers a lot of inconsistency and misuse. In reports always list the metric and how you define it; that way confusion and inevitable fruitless debate is reduced. It is useful to read "TimeGlobal Process Cycle Time," "TimeIndividual Step Cycle Time," "TimeReplenishment Time," and "TimeTakt Time" in this chapter prior to proceeding with data capture to ensure comprehension. OverviewSimply put, the Process Lead Time is the time taken for a single entity to traverse the whole process from beginning to end. The way to think of this is to consider yourself being stapled to the entity; starting a stopwatch at commencement of the first step in the process and stopping the stopwatch after completing the last step in the process. Process Lead Time takes into account all the delays throughout the process (transportation, and so on), including the entity sitting in inventory between steps. See Figure 7.47.1. Figure 7.47.1. Graphical representation of Individual Step Cycle Time.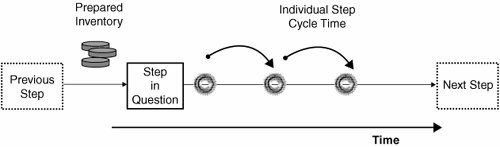 Figure 7.48.1. Graphical representation of Process Lead Time (versus Replenishment Time).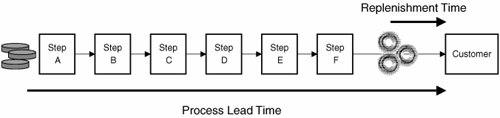 Thus, the Process Lead Time is the sum of all the Individual Step Cycle Times plus all the delays. LogisticsCalculating the Process Lead Time requires involvement from the process operators, to both set up and capture the data. Data should be captured over a representative time period to take into account variation due to noise factors in the process. It takes approximately 12 hours of a preparatory meeting to identify exact timing points through the process, preferably using an already constructed VSM, and then structure a data capture method. It is always useful to do a dry run data capture, to ensure the correct data is being captured and no biases are creeping in, but inevitably some Hawthorne Effect does occur. For more detail regarding the data capture, see "KPOVs and Data" in this chapter. Process Lead Time often varies by entity type. It is useful, therefore, to capture either data for one entity type or preferably data for all (or multiple) entity types and then stratifying the Process Lead Time by type during the data analysis. RoadmapCalculating the Process Lead Time is usually part of a Multi-Cycle Analysis. Ten data points suffice for calculating an average Process Lead Time, but 3050 points are required to understand the variation in the metric.
Interpreting the OutputInterpreting the Process Lead Time should not be done in isolation from other elements. The trick is to understand the relationship between the internal times relating to our process:
And to understand the relationship with the external Customer or Market related times:
By looking at the Process Lead Time versus the requested Delivery Lead Time, it becomes apparent whether an entity can be processed from scratch to meet an order, or whether inventory is needed throughout the process to maintain an effective Replenishment Time less than the Process Lead Time. For some processes, a Replenishment Time shorter than the Process Lead Time is not possible (every entity must be processed from scratch when an order arrives); thus, the only solution in this case is to shorten the Process Lead Time, by eliminating NVA activity throughout the process. |
EAN: 2147483647
Pages: 138
- Option 1: Inter-Provider VPN Using Back-to-Back VRF Method
- CSC Architecture Benefits
- Introduction to Layer 2 VPNs
- L2 VPN-Any to Any Interworking
- Case Study 2: Implementing Multi-VRF CE, VRF Selection Using Source IP Address, VRF Selection Using Policy-Based Routing, NAT and HSRP Support in MPLS VPN, and Multicast VPN Support over Multi-VRF CE