Tracing and Monitoring Your Application
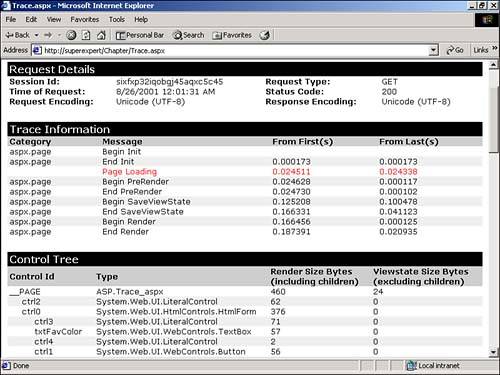
| In the following sections, you learn how to trace the execution of your ASP.NET application and monitor its performance. First, you learn how to enable tracing for both pages and applications. By taking advantage of tracing, you can make your pages easier to debug. Next , you examine how to monitor the ASP.NET process and automatically restart an ASP.NET application when problems are detected . You learn how to configure the ASP.NET process model. You also learn methods for reading and adding information to the server event log and create custom event logs to monitor the health of your ASP.NET application. Finally, you learn how to work with performance counters. I provide an overview of the performance counters included with the ASP.NET framework that you can use to monitor the performance of your application. You also learn how to create custom performance counters. Tracing Page ExecutionYou can trace the execution of an ASP.NET page by using the trace attribute of the page directive. To enable tracing for a single ASP.NET page, include the following directive at the top of the page: <%@ Page Trace="True" %> When tracing is enabled for a page, trace information is automatically appended to the bottom of the page (see Figure 18.7). The trace information includes the following statistics:
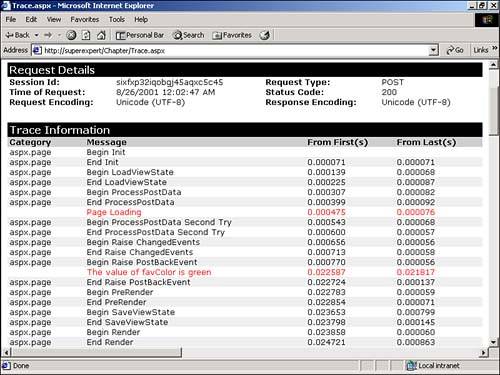
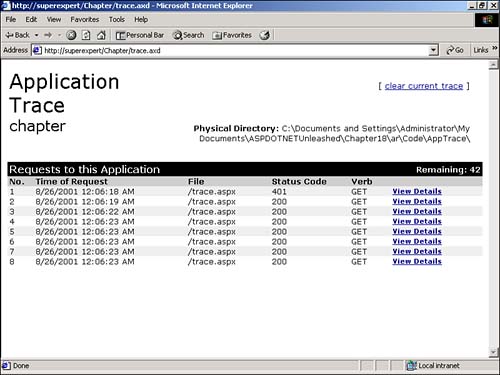
Figure 18.7. Page with tracing enabled. All sections are not necessarily displayed when tracing is enabled. For example, the Form Collection section is displayed only when form data has actually been posted. Notice that you can use the information from the Control Tree section to determine the size of the view state for each control. Because view state must be stored in the hidden __VIEWSTATE form field and passing a large hidden form field can significantly affect the rendering speed of a page, limiting the size of view state is a wise idea. You can use the Control Tree section to identify the controls using the most view state. The Trace Information section provides information about the methods called to render the page. The ASP.NET framework automatically inserts certain messages into this section. For example, information about the page Init and PreRender events is automatically inserted into this section. Adding Custom Trace MessagesYou can add your own custom trace messages to the Trace Information section. Adding custom trace messages is valuable for debugging an application. While you're in the process of debugging a page, you can enable tracing and view all your custom trace messages. For example, you can display the value of variables at different points of page execution. When you are satisfied with the page, you can simply turn off tracing and hide all your messages. ASP CLASSIC NOTE In Classic Active Server Pages, the only trace tool was the Response.Write statement. Typically, you were forced to isolate errors by adding Response.Write statements throughout the page. If you forgot to comment out a Response.Write statement that you added for debugging purposes, the entire world would see your debugging information. To add custom trace messages, use either the Trace.Warn or Trace.Write methods. The only difference between these methods is that Trace.Warn displays messages in a red font and Trace.Write displays messages in a black font. The page in Listing 18.16, for example, adds custom trace messages to the Trace Information section (see Figure 18.8). Listing 18.16 Trace.aspx<%@ Page Trace="True" %> <Script Runat="Server"> Sub Page_Load Trace.Warn( "Page Loading" ) End Sub Sub Button_Click( s As Object, e As EventArgs ) Trace.Warn( "The value of favColor is " & txtFavColor.Text ) lblMessage.Text = "Button Clicked!" End Sub </Script> <html> <head><title>Trace.aspx</title></html> <body> <form Runat="Server"> <h2>Enter your Favorite Color</h2> <b>Favorite Color:<b> <br> <asp:TextBox ID="txtFavColor" Runat="Server" /> <asp:Button Text="Click Here!" OnClick="Button_Click" Runat="Server" /> <p> <asp:Label ID="lblMessage" Runat="Server" /> </form> </body> </html> The C# version of this code can be found on the CD-ROM. Figure 18.8. Page with tracing enabled. In Listing 18.16, trace messages are displayed in both the Page_Load and Button_Click subroutines. For example, the trace message in the Button_Click subroutine displays the value that the user entered into the TextBox control. Detecting Whether Tracing Is EnabledIf you need to execute code only when tracing is enabled, you can use the Trace.IsEnabled property to detect whether tracing is currently enabled or disabled for a page. For example, suppose that you want to display all the items in a collection in a trace message. The page in Listing 18.17 creates a string that contains the values of all the items in a collection only when tracing is enabled. Listing 18.17 TraceIsEnabled.aspx<%@ Page Trace="True" %> <Script Runat="Server"> Sub Page_Load Dim colArrayList As ArrayList colArrayList = New ArrayList() colArrayList.Add( "red" ) colArrayList.Add( "green" ) colArrayList.Add( "aliceblue" ) If Trace.IsEnabled Then Dim strTraceMessage As String Dim strItem As String For Each strItem in colArrayList strTraceMessage &= strItem & "," Next Trace.Warn( strTraceMessage ) End If dropColors.DataSource = colArrayList dropColors.DataBind End Sub </Script> <html> <head><title>TraceIsEnabled.aspx</title></html> <body> <form Runat="Server"> <h2>Enter your Favorite Color</h2> <b>Favorite Color:<b> <asp:DropDownList ID="dropColors" Runat="Server" /> </form> </body> </html> The C# version of this code can be found on the CD-ROM. When tracing is enabled, the page in Listing 18.17 displays all the items in an ArrayList in a trace message. When tracing is disabled ”the Trace page directive has the value False ”the trace message is not created. Creating Trace CategoriesBy default, trace messages are displayed in order of execution. For example, a trace message added within the Page_Load subroutine will be displayed before a trace message added in the Page_PreRender subroutine. Instead of displaying trace messages in order of execution, you can create different categories for trace messages and group the messages into the categories. For example, you could create distinct categories for database trace messages and form trace messages. The page in Listing 18.18 illustrates how to group trace messages into different categories. Listing 18.18 TraceCategories.aspx<%@ Page Trace="True" TraceMode="SortByCategory" %> <%@ Import Namespace="System.Data.SqlClient" %> <Script Runat="Server"> Sub Page_Load Dim conPubs As SqlConnection Dim cmdSelect As SqlCommand conPubs = New SqlConnection( "Server=Localhost;UID=sa;PWD=secret; Database=Pubs" ) cmdSelect = New SqlCommand( "SELECT au_lname FROM Authors", conPubs ) Trace.Warn( "Database", "Opening Connection" ) conPubs.Open() dropAuthors.DataSource = cmdSelect.ExecuteReader() dropAuthors.DataTextField = "au_lname" Trace.Warn( "Database", "Binding to DropDownList" ) dropAuthors.DataBind Trace.Warn( "Database", "Closing Connection" ) conPubs.Close() End Sub Sub Button_Click( s As Object, e As EventArgs ) Trace.Warn( "Form", "User selected " & dropAuthors.SelectedItem.Text ) End Sub </Script> <html> <head><title>TraceCategories.aspx</title></head> <body> <form Runat="Server"> <h2>Choose an Author</h2> <b>Author Last Name:<b> <asp:DropDownList ID="dropAuthors" Runat="Server" /> <asp:Button Text="Select!" OnClick="Button_Click" Runat="Server" /> </form> </body> </html> The C# version of this code can be found on the CD-ROM. Notice that the page directive at the top of the page in Listing 18.18 contains a TraceMode attribute. This attribute can have one of two values: SortByTime or SortByCategory . Because you want to group trace messages by category, you set TraceMode to the value SortByCategory . When each trace message is created with the Trace.Warn statement, the category is specified. For example, the following Trace.Warn statement creates a trace message in the category Database : Trace.Warn( "Database", "Opening Connection" ) You can, of course, invent any categories you please . All your custom trace messages appear at the bottom of the Trace Information section. Displaying Errors in Trace MessagesIf you use TRY...CATCH statements in your ASP.NET pages to gracefully handle errors (as you should), errors are not displayed in the page when something goes wrong. The lack of error messages can make the process of debugging a page difficult. Fortunately, you can display the errors caught in TRY...CATCH statements within trace messages. The page in Listing 18.19, for example, contains an error. The statement that causes the error is wrapped in a TRY...CATCH statement, so the error is not displayed in the page. However, the error is displayed within a trace message. Listing 18.19 TraceException.aspx<%@ Page Trace="True" %> <Script Runat="Server"> Sub Page_Load Dim txtTextBox As TextBox Try txtTextBox.Text = "Hello!" Catch objException As Exception Trace.Warn( "Page Errors", "Assigning Value To TextBox", objException ) End Try End Sub </Script> <html> <head><title>TraceException.aspx</title></head> <body> <h2>This page contains an error!</h2> </body> </html> The C# version of this code can be found on the CD-ROM. In Listing 18.19, you pass three parameters to the Trace.Warn method: the category of the trace message, the text of the trace message, and the exception caught in the TRY...CATCH block. The values of all three parameters are displayed in the Trace Information section when tracing is enabled. Using Application-Level TracingYou can use a special page, named trace.axd , to view trace information collected from all the pages in your application. By default, the trace.axd page automatically displays a list of the first 10 requests to your application after application tracing is enabled. A View Details link appears next to each item in the list, linking to a page that shows detailed trace information for that request (see Figure 18.9). Figure 18.9. Application-level tracing. Before you can use the trace.axd page, you must enable application-level tracing within either the Machine.Config file or root Web.Config file for your application. The Web.Config file in Listing 18.20 contains the necessary values to enable application-level tracing. (You can find this file in the AppTrace directory on the CD that accompanies this book.) Listing 18.20 AppTrace/Web.Config<configuration> <system.web> <trace enabled="true" requestLimit="50" pageOutput="false" traceMode="SortByTime" localOnly="true" /> </system.web> </configuration> The C# version of this code can be found on the CD-ROM. The Web.Config file in Listing 18.20 enables application-level tracing on the local machine. It specifies that trace statistics should be stored for the last 50 requests. The trace configuration section contains the following five elements:
CAUTION If you want to disable the trace.axd page on a production Web site, you need to remove the reference to the trace page handler in the Machine.Config file. You can remove this entry from the httpHandlers section. Monitoring the ASP.NET ProcessASP.NET applications execute in a separate process from the Web server. The Web server executes in a process named inetinfo.exe , and ASP.NET applications execute in a process named aspnet_wp.exe (the ASP.NET worker process). You can modify several configuration settings that affect the behavior of the ASP.NET process. These configuration settings can be divided into two groups. The first group enables you to automatically restart the ASP.NET process in response to problems such as memory leaks, deadlocks, and access violations:
When the ASP.NET worker process exceeds the memory or request queue limit, the process is automatically shut down and replaced by a new worker process. All the pending requests to the old process are automatically transferred to the new process. In theory, this should mean that the handoff between processes should be undetectable to the users of the application. You can modify these settings in the <processModel> section of the Machine.Config file. These setting are read directly by aspnet_isapi.dll when the ASP.NET worker process is started. The second group of configuration settings enables you to automatically restart the ASP.NET process after a certain amount of time or a certain number of requests:
You can use these settings to automatically recycle the ASP.NET process every so often, to reclaim memory lost to memory leaks or dump bad code from memory. For example, the following processModel section automatically shuts down the ASP.NET process once every 24 hours: <processModel enable="true" timeout="24:00:00" /> You can test processModel configuration settings by using the page in Listing 18.21. CAUTION The page in Listing 18.21 is designed to crash the ASP.NET process by consuming too much memory. Listing 18.21 ProcessModel.aspx<%@ Import Namespace="System.IO" %> <Script Runat="Server"> Sub Page_Load Dim objStream As MemoryStream objStream = Application( "Stream" ) If IsNothing( objStream ) Then objStream = New MemoryStream() objStream.WriteByte( 255 ) End If objStream.WriteTo( objStream ) Application( "Stream" ) = objStream lblMemory.Text = objStream.Length lblProcessID.Text = _ ProcessModelInfo.GetCurrentProcessInfo.ProcessID End Sub </Script> <html> <head><title>ProcessModel.aspx</title></head> <body> Memory Consumed: <asp:Label ID="lblMemory" Runat="Server" /> bytes <p> Process ID: <asp:Label ID="lblProcessID" Runat="Server" /> </body> </html> The C# version of this code can be found on the CD-ROM. The page in Listing 18.21 doubles the amount of memory that it consumes every time you request it. It also displays the ID of the current process. Notice that when you pass a certain threshold ”the percentage of physical memory specified by the memoryLimit setting ”a new process automatically replaces the current process. Retrieving Process InformationYou can use the ProcessModelInfo class to retrieve information about the ASP.NET process. The GetCurrentProcessInfo method returns information about the ASP.NET process currently executing, and the GetProcessInfoHistory method returns a history of ASP.NET processes. Both methods return instances of the ProcessInfo class, which has the following properties:
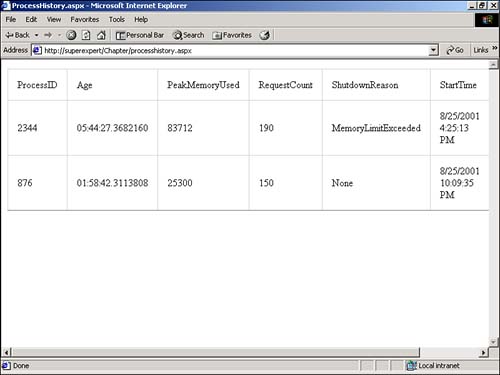
The page in Listing 18.22, for example, displays information about the last 10 ASP.NET processes (see Figure 18.10). Listing 18.22 ProcessHistory.aspx<Script Runat="Server"> Sub Page_Load dgrdHistory.DataSource = ProcessModelInfo.GetHistory( 10 ) dgrdHistory.Databind() End Sub </Script> <html> <head><title>ProcessHistory.aspx</title></head> <body> <asp:DataGrid ID="dgrdHistory" CellPadding="15" AutoGenerateColumns="False" Runat="Server"> <Columns> <asp:BoundColumn HeaderText="ProcessID" DataField="ProcessID"/> <asp:BoundColumn HeaderText="Age" DataField="Age"/> <asp:BoundColumn HeaderText="PeakMemoryUsed" DataField="PeakMemoryUsed"/> <asp:BoundColumn HeaderText="RequestCount" DataField="RequestCount"/> <asp:BoundColumn HeaderText="ShutdownReason" DataField="ShutdownReason"/> <asp:BoundColumn HeaderText="StartTime" DataField="StartTime"/> <asp:BoundColumn HeaderText="Status" DataField="Status"/> </Columns> </asp:DataGrid> </body> </html> The C# version of this code can be found on the CD-ROM. Figure 18.10. Viewing process history. |
EAN: 2147483647
Pages: 263