Hack47.Report Telephone Activity with Excel
Hack 47. Report Telephone Activity with Excel
With a little help from Microsoft Excel, you can dig into your CDRs, chart your top callers, and create utilization records for the users of your PBX server. Most commercial softPBX systems provide a detailed logging mechanism for keeping track of when and to whom calls were made and received. Asterisk provides this, too. In /var/log/asterisk/cdr-csv/Master.csv, a flat text log of all call activity is retained. It's a snap to import this into Excel or your favorite spreadsheet for analysis. You can download the file from your server using FTP, or you can run the following command to email it to you (keep in mind that large logfiles might not work well with this trick): # cat /var/log/asterisk/cdr-csv/Master.csv | mail me@mydomain.com Of course, replace me@mydomain.com with your email address. If your Linux server has sendmail or a similar Simple Mail Transfer Protocol (SMTP) agent running (most do), the contents of the file will be emailed to you. You can then copy and paste them into Excel, as shown in Figure 4-4. Place the cursor on column A, row 1 before pasting. Figure 4-4. A portion of the Asterisk ASCII call-detail-record (CDR) logfile, copied and pasted into the Macintosh version of Excel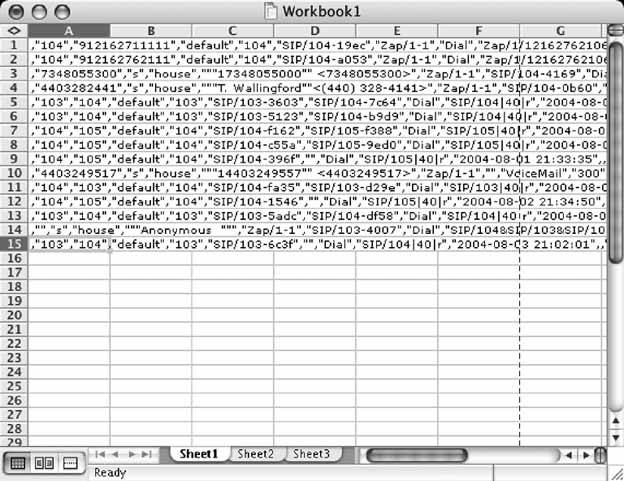 Once you paste the text or open the file, select column A by clicking the A column heading. Then use Excel's Text to Columns function, on its Data menu. This will launch a wizard that will help you organize the text file into columns so that it's actually useful within Excel. You'll see a preview of the text you pasted in the bottom portion of the window that appears. Leave the Delimited radio button selected and then click Next. Select Comma as a delimiting character, make sure no other delimiters are selected, as in Figure 4-5, and click Finish. Now, you're ready to label the column headings according to their purposes. Insert a blank row at the top of the spreadsheet, and you can label them as outlined in Table 4-1. Figure 4-5. The second step of the Text to Columns Wizard breaks up the CDR log text into meaningful cells of data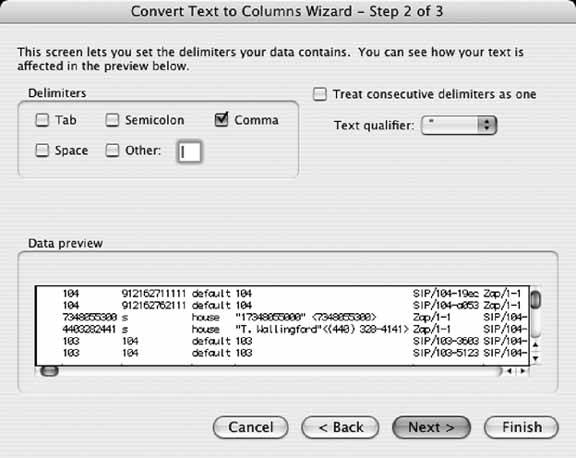
The field names marked with an asterisk (*) record Asterisk proprietary information. For example, the Application field might not have a meaningful correlation on another softPBX because not all softPBXs refer to telephony functions as applications. The idea here is that once the CDR is imported into Excelor another data-analysis toolyou can interpret it in interesting ways. Suppose you want to figure out which customer places the most calls to your technical support department. You can count occurrences of that customer's caller ID in the CDR. Or, if your teenage daughter is receiving a dozen calls a day, you can bill her accurately for them! With CDRs in Excel, Crystal Reports, or even a homegrown Perl program, a savvy telephony administrator can do the following:
4.8.1. Creating a Call ReportOne of Excel's coolest features is the Pivot Table Report. I actually used Excel for years without touching this menu option, passing over it dozens of times, until one day I had to build a sales report for an application I'd been developing. I had a choice between coding the report myself, building it in a tool like Access, or performing the analysis in Excel. The only problem with that last option was that I didn't know how to do the analysis in ExcelI knew only that it could be done. So, I turned to the Pivot Table Report (or should I say, Iahempivoted to it) and built a sales summary in five minutes, which to this day is still in use at the office where I built it. Needless to say, I've sworn by the Pivot Table Report function ever since. I never knew what I was missing out on by passing over that peculiarly intimidating Excel menu option. And, when it comes to those telephony logs, the Pivot Table Report function ever since. I never knew what I was missing out on by passing over that peculiarly intimidating Excel menu option. And, when it comes to those telephony logs, the Pivot Table Reports, you can generate some very cool call-activity analysis. List your top callers. List your top system users. Or just figure out your total long-distance and local utilization down to the minute to verify your phone bills. We'll do one report that sums activity (in minutes) by caller and a second report that adds a breakdown of the total minutes for every phone number called by each caller. To get started, we'll first need to get our hands on the Asterisk CDR logfile, as described at the beginning of this hack. Next, we'll insert a blank row at the top of the worksheet and key in the names of the CDR fields at the top of each column, as shown in Figure 4-6. This will be needed to make the Pivot Table Report. (The names of the CDR fields are laid out in Table 4-1.) Once the CDR columns are labeled, select Data Figure 4-6. The CDRs, imported into Excel Figure 4-7. A pivot-table toolbar with Asterisk CDR fields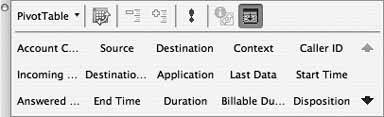 Now, you can drag those column names from the pivot-table toolbar to the left and right columns of the blank Pivot Table Report worksheet. Dragging to the left pivot-table column treats the data from that CDR column as a group label. If you're familiar with Crystal Reports or Access, data grouping in reports should be a friendly concept. If not, read onyou're in good hands. Dragging to the right column of the Pivot Table Report worksheet treats the data from the CDR column as summary data. It's probably easier just to start dragging column headings and see what happens. Start by dragging the Source column to the left column in the pivot table. Next, drag the Duration column to the right column in the pivot table. These two drags will build a report like the one in Figure 4-8, which shows a sum of minutes for each caller on the system over the period of time covered by the CDR worksheet. In Figure 4-8, the majority of callers are PSTN phone numbers (the 10-digit numbers), though the majority of minutes are from private extensions (104, 200, etc.). Extension 200 has the most minutes261. Of course, this report doesn't tell us how extension 200 spent all those minutes (whom 200 was talking to), so let's drag another CDR heading from the toolbar to the lefthand column. Drag the Destination column, and the report will now show the minute totals of each phone number to whom each caller placed calls, as shown in Figure 4-9. Figure 4-8. A Pivot Table Report that shows all the minutes of call activity on the system, broken out by caller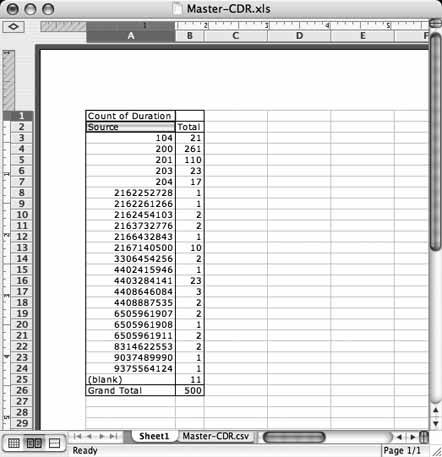 Experiment with the other columns. What can Excel tell you about your call activity? With these reports, you'll have a handle on precisely who called whom, and when. That way, if your mom ever says, "Why don't you ever call?" you'll have the perfect response: "Mom, we talked 108 minutes last week alone, and 96 minutes the week before!" Figure 4-9. A Pivot Table Report that shows detailed minute totals for each extension, for every phone number called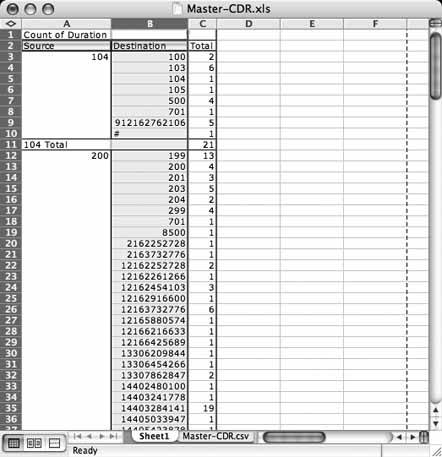 |

 Pivot Table Report. Now, youll get a wizard. Click Next on the first step, where you'll find yourself being prompted to provide the name of a data range where the source data exists. In this case, the source data is the first sheet in the workbookthe one that contains the CDR data. Select this sheet and drag-select all of the columns that contain CDR data. Then, return to the wizard window and click Next. The final step asks you where you want to put the report; choose the option to place it in a new worksheet. Then, click Finish. As shown in Figure 4-7, you'll now have a pivot-table toolbar with the names of your CDR columns on it.
EAN: 2147483647
Pages: 156