Hack81.Peek Inside of SIP Packets
Hack 81. Peek Inside of SIP Packets
When the going gets tough, the tough sniff packets. Adding VoIP to any network can be a daunting challenge, but accomplishing the task can seem particularly impossible when problems begin to arise. To help troubleshoot any network problems, being proficient with the use of network-analysis tools can provide some restful nights. Ethereal is a network-analysis tool that allows for the "sniffing" or capturing of data packets on the network. Ethereal has some VoIP-specific features, too. By digging deep into VoIP signaling conversations with Ethereal and assessing SIP traffic problems using a conventional call-flow graph, you'll reveal the source of many problems you're likely to encounter. Because of the dominance of SIP, this exercise will concentrate on using only the features of the Ethereal sniffer that support analyzing this protocol rather than any of the protocols that came before it (MGCP, H.323, etc.). Feel free to learn those other protocols if you like, but know that almost every commercial VoIP provider uses SIP (when I say almost, I mean 95% or more). You can use Ethereal to inspect network traffic from the Ethernet layer all the way up to the application layer. Packets are captured in a buffer and are displayed on the screen. Filters can be applied to restrict the capture to packets matching a certain source, destination, size, protocol, or service. To obtain Ethereal, download it from http://ethereal.com/ and install it on your Windows, Mac, or Linux box. The screenshots and examples here assume the Windows version. On a switched network, a nonadministrative user can only capture packets being sent to or from his own machine. So, to keep things simple, this hack monitors traffic for the SIP softphone known as X-Lite [Hack #4]. Both X-Lite and Ethereal will need to be running on the same machine. If you're using a nonswitched network, like a hub, Ethereal can observe packets not bound for or originated from your PC, which means you'll be able to monitor all VoIP traffic without restrictions. But for now, I'll assume you can monitor traffic only on your own PC.
To demonstrate SIP packet observation with Ethereal, we'll set up a filter that allows us to capture SIP registration signals in two scenarios: one for a successful SIP registration and another for a failed SIP registration. As in the other projects, the SIP server's IP address is 10.1.1.10. In this instance, Asterisk is used as the SIP server.
6.11.1. Configure the SIP SoftphoneIf you're setting up X-Lite for the first time, you'll need to click the Configuration button, right of the center, next to the Clear button (see Figure 6-2). Once you click this button, you'll see the Configuration menu. In the Configuration menu, double-click Menu and then select System Settings Once configured, the SIP softphone will automatically register with the SIP registrar as soon as you close the Configuration menu. If registration was successful, you'll see Logged In in the UI display, as shown in Figure 6-2. If it wasn't, make sure the SIP proxy profile called [default] is enabled and is configured to match a SIP account on the server. 6.11.2. Configure EtherealOnce Ethereal is installed, launch it. Next, begin a capture by selecting Capture Figure 6-2. The X-Lite softphone's user interface In this case, our SIP server is 10.1.1.10, and the standard port for SIP traffic is UDP 5060. We want to capture traffic in both directionsthat is, to the SIP server and to the softphone running on the same host as Ethereal. Here is the string that achieves this: host 10.1.1.10 and udp port 5060 Check the "Update packets in real time" and "Automatic scrolling in live capture" options to see the packet capture log occur immediately instead of waiting until the capture session is complete. Then, click OK, and the main capture window will appear. You're now ready to observe your SIP registration attempts. 6.11.3. Observe SIP RegistrationNow, restart X-Lite. It will attempt to register automatically with the SIP server upon startup. By the time X-Lite says you're "Logged In," you can stop the packet capture by clicking Ethereal's Capture Figure 6-3. X-Lite's SIP client configuration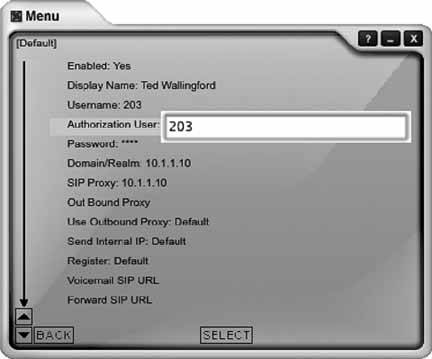 The main capture window should be filled up with a number of packets, as shown in Figure 6-5. In this instance, Ethereal shows the first packet, packet number 1, as a SIP REGISTER method. Newer versions of Ethereal, such as the 0.10.7 version used here, can parse SIP packets and tell you which methods and responses they contain. Packet 4 is a second registration request (the first one failed because X-Lite tries anonymous registration first). Packet 5 is the 100 TRying SIP response sent from the SIP server back to the softphone. Packet 6 is the 200 OK SIP response sent from the SIP server back to the softphone, indicating that the registration was successful. Packet 7 is a SIP NOTIFY method asking for username 204 at the SIP registrar. Packet 8 is the 200 OK response. At this point, registration is complete. The additional packets (9 and 10) are keep-alive packets that X-Lite sends to its SIP registrar. Not all SIP phones do this. The bottom pane of the main capture window shows the actual hexencoded content of the packet and the ASCII-encoded content of the packet that corresponds to it. The hex is on the left, and the ASCII is on the right. This is where you can usually pick out problems: an incorrect password or a botched username would be easy to spot this way. Figure 6-4. Ethereal's Capture Options dialog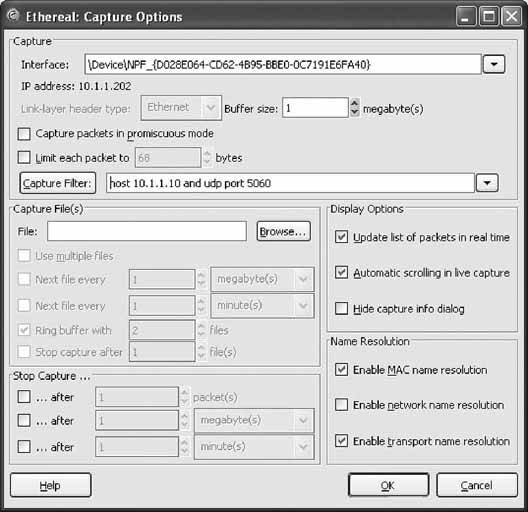 Figure 6-5. An Ethereal capture of a SIP registration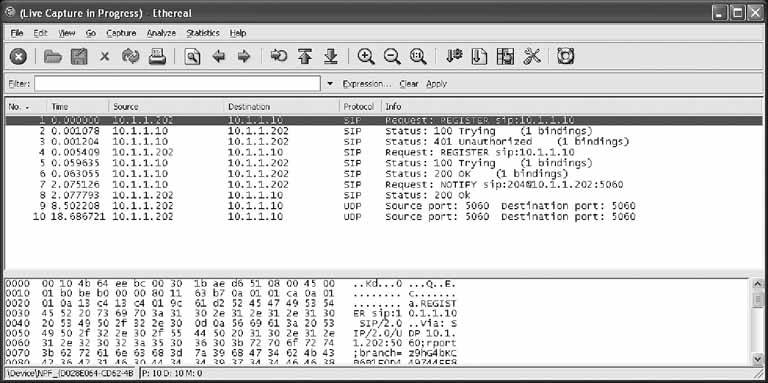 6.11.4. Observe Registration FailureOutside the test lab, you probably won't have occasion to capture SIP packets unless something is working incorrectly. But then, why else would you need a packet sniffer? Simulating a registration failure is very easy. Just alter the registration username of the SIP proxy profile in X-Lite to one that doesn't match a SIP peer on the SIP server. (Be sure that your softPBX requires SIP clients to use a username and password; you can configure Asterisk to allow anonymous registration!) Then, start the Ethereal capture with the filter string used earlier, restart X-Lite, and watch the registration crash and burn. 6.11.5. Capture SIP StatisticsOnce you have saved a capture file, you should be left with a trace screen that looks something like Figure 6-6, showing all the data packets captured. Figure 6-6. An Ethereal packet capture log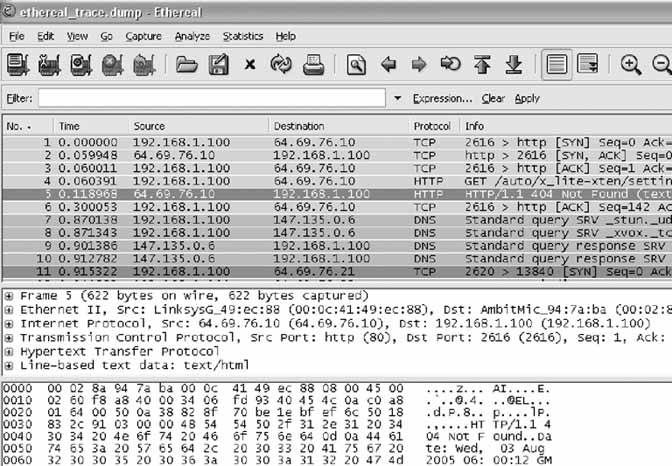 To help sort through all this captured data, you will use Ethereal's handy SIP statistics tool by navigating to Statistics Figure 6-7. Ethereal's SIP statistics dialog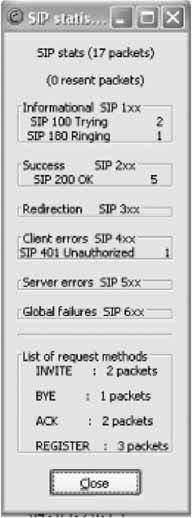 Ethereal has many built-in tools for filtering and colorizing data traces, but it can be a bit overwhelming to digest all of the data at once. To help network administrators graphically view the call flow of a SIP signaling conversation, navigate to Statistics The illustration technique used in Figure 6-8 is a standard way of representing data conversations. In Chapter 7 of O'Reilly's Switching to VoIP, the details of SIP signaling are covered with a half-dozen examples that are graphed in this fashion. A standard convention of a SIP call-flow graph is the direction arrow. In this example, there are many of them: one for each SIP message sent. When you click on one of the arrows, it automatically drills down to the specific packet regarding that part of the call flow in the trace window. This is fantastic for literally stepping through the signaling steps of call setup and tear-down. Figure 6-8. A SIP call, graphed by Ethereal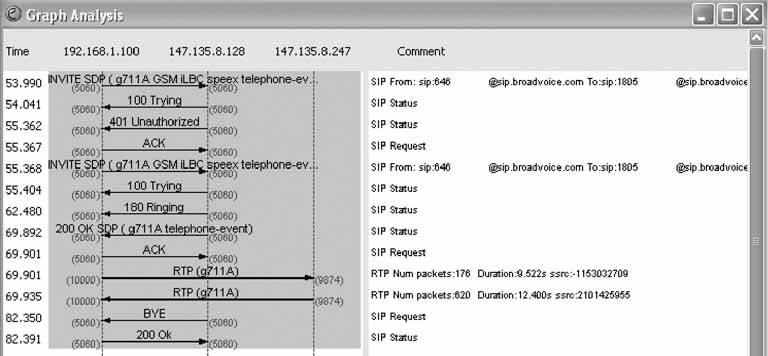 Joel Sisko |

 SIP Proxy
  [default]. This will take you to the SIP client configuration, as shown in Figure 6-3. Here, you can configure the softphone to register using a number and/or password to match what youve established in the dial-plan configuration on the SIP server.
EAN: 2147483647
Pages: 156