Importing Organizational Data to Create a Chart
|
Most companies store employee data electronically in a human resources database. You can save time by using the Organization Chart Wizard to import your employee information and generate an organization chart, as Figure 10-6 shows. Visio can import from any ODBC- compliant data source (Microsoft SQL Server, for example), Microsoft Exchange Server, Microsoft Office Excel 2003, and text files. You can also use the wizard to set up an Excel or text file with employee information, and then import it.
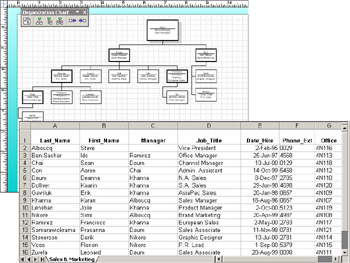
Figure 10-6: The Organization Chart Wizard can generate a multiple-page chart from a variety of data sources, including Excel.
To import employee data, the wizard requires that a data source include at least an employee name and the name of the employee’s manager. Specifically, the wizard looks for a Name and requires a Reports To field in your data source so it can create the right type of connection to your other shapes. For the employee at the top of a hierarchy, such as a CEO or president, leave the manager or Reports To field blank. If the data source also includes a Department, Title, and Telephone field with those names, Visio imports the data into the shapes’ built-in custom properties. If your fields have different names, you can import the data anyway, but you might end up with duplicate fields in the Custom Properties window. If your data source includes other organizational data, such as office location or date of hire, you can import it as well. Visio adds this information as new custom properties.
Importing Data from an Existing File
You can start a new diagram with the Organization Chart Wizard, or start the wizard from within an existing diagram. In either case, the wizard walks you through the process of selecting an existing data source, mapping its fields to shapes and custom properties in Visio, and then choosing the number of pages to generate. The key to success with the wizard is knowing how the columns in your data file relate to the data you want in your organization chart. Because an organization chart is dependent on reporting relationships, your data file must include a column that shows each employee’s manager.
If you use enterprise planning software, such as PeopleSoft or SAP/R3, you might find it easier to create a macro or executable file that generates an organization chart without stepping through the Organization Chart Wizard. For details about this method of working, see the topic in Visio Help called “Run the Organization Chart Wizard from the Command Line.”
Step 1: Identify the Data Source
When you start the Organization Chart Wizard, you can choose whether to start from an existing data source or create a new one, as Figure 10-7 shows.
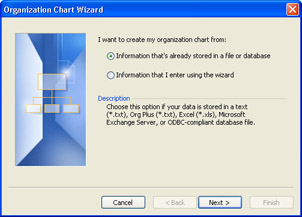
Figure 10-7: On the first screen of the Organization Chart Wizard, you can choose whether to import information from a data source or to create a file that can be imported.
Follow these steps to start a diagram and start the Organization Chart Wizard:
-
Start Visio, and in the Choose Drawing Type window, choose Organization Chart, Organization Chart Wizard.
Note In an existing organization chart diagram, choose Organization Chart, Import Organization Data. In a drawing file based on a different template, choose Tools, Add-Ons, Organization Chart, Organization Chart Wizard.
-
On the first screen, select Information That’s Already Stored In A File Or Database, and then click Next.
-
On the next screen, select the type of file you’re importing, and then click Next. The options vary depending on the type of file you’re importing.
-
Follow the instructions to locate the file, directory, or data source, and then click Next to continue with the wizard.
Step 2: Map Data to the Organization Chart
On the next screen of the Organization Chart Wizard, you map the columns from your data source to the columns the wizard expects, as Figure 10-8 shows. The wizard requires only the Name and Reports To fields, which it uses to lay out the chart. In the Name box, select the field in your data source that contains the complete employee name. If your data source provides two or more fields for the name (for example, First Name and Last Name fields), select the field for last name, and then in the First Name box, select the field for first name. In the Reports To box, select the field in your data source that contains the manager name. Click Next to continue.
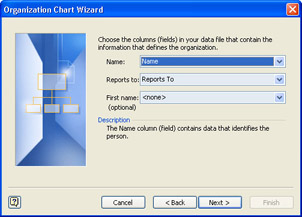
Figure 10-8: The wizard assumes that your data source provides the full employee name in a single field. If not, use both the Name and First Name lists on this screen.
Step 3: Specify the Information to Display
When the wizard creates the organization chart, it labels each shape with data from the fields you select on the next screen of the Organization Chart Wizard, as Figure 10-9 shows. To choose shape labels, select a field in the Data File Columns list, and then click Add. The Displayed Fields list lists the fields in the order in which they will be displayed, and the wizard previews the results. If the previewed shape doesn’t look the way you want, you can do the following:
-
To remove a field from the display, select the field in the Displayed Fields list, and then click Remove.
-
To change the order in which fields appear, select a field in the Displayed Fields list, and then click Up or Down.
Click Next to continue.
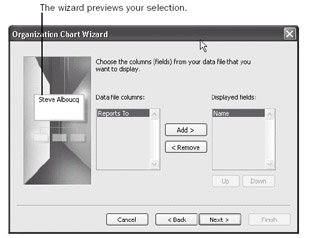
Figure 10-9: On this screen, you can choose the text that appears on shapes.
Step 4: Specify Custom Property Fields
One of the benefits of a Visio organization chart is the data behind the drawing. You can import as many additional data fields as you like as custom properties on the next screen of the wizard, as Figure 10-10 shows. In the Data File Columns list, select a field from your data source, and then click Add to add it to the organization chart as a custom property. The Custom Property Fields list shows all the properties that the wizard will add to employee shapes in the organization chart. When you’ve completed the list, click Next.
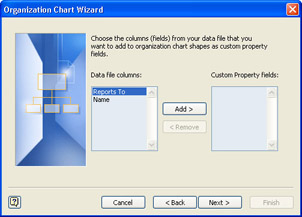
Figure 10-10: You can add additional fields of information as custom properties that Visio stores for each shape in the organization chart.
| Tip | To see the properties associated with an employee, display the Custom Properties window (View, Custom Properties Window) or right-click a shape and select View, Custom Properties Window. When you select a shape, its properties are displayed. |
If you selected the An ODBC-Compliant Data Source option on the second wizard screen, you will see an additional screen at this point that allows you to choose how you want the data to be stored with the chart. The benefit of importing data to create an organization chart is that the data you maintain about employees can be stored as custom properties for the shapes in the organization chart. You can either copy the values from the data source cells into the custom property fields for shapes, or you can create dynamic links between the source data and the chart shapes. Linking data allows you to keep the chart up to date with any changes you make to the database. Select the Copy Database Records To Shapes option to copy data, or select the Link Database Records To Shapes option to link data, and then click Next. For details, see “Linking Shapes and Databases,” page 721.
Step 5: Choose Layout Options for Large Organization Charts
An organization of more than 20 or 30 employees is probably too large to fit on a single letter- sized page. On the next screen of the wizard, you can decide how you want your chart to be divided across pages, as Figure 10-11 shows. If you want to control exactly which groups appear on pages of a multiple-page chart, choose the first option. Otherwise, let Visio do the work and select the second option, in which case the wizard will divide the chart only if it doesn’t fit on a single page.
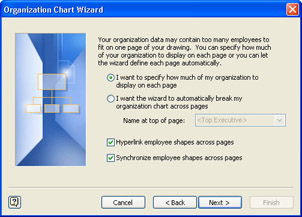
Figure 10-11: You can specify where to break a large organization chart across pages or let the wizard do it for you.
| Tip | You might want to divide your organization chart into mulle pages even if it all fits on one page. For example, select the I Want To Specify… option if you want to include only high-level employees on one page and more detail on successive pages. |
You can choose to display the same employee on more than one page by synchronizing employee shapes and optionally creating links between the synchronized copies. For example, a manager can appear on a top-level page and also on a detail page that includes the employees who report directly to him or her. When you import your organizational data, you can choose the following options on this wizard screen:
-
Hyperlink Employee Shapes Across Pages Select this check box to create links between shapes that represent the same employee on different pages.
-
Synchronize Employee Shapes Across Pages Select this check box to synchronize shapes that represent the same employee on different pages. If the shapes are synchronized, changes you make to the text and custom properties for the shape on one page affect the data for that shape on other pages.
Step 6: Choose Where to Break Pages
If you select the I Want To Specify… option, when you click Next, the wizard provides the options shown in Figure 10-12. Initially, the wizard shows only one page that lists the highest ranking employee in the data file. When you add a page, you select the top-ranking employee to display on that page and up to eight subordinate levels.
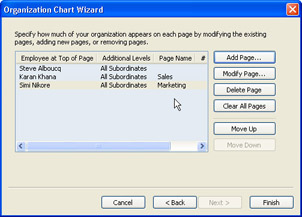
Figure 10-12: On this screen, the wizard shows you the top-level employee on each page of a multiple-page organization chart.
| Tip | To get a better view of your data, you can resize a column in the preview area of the wizard. The headings (Page Number, Employee At Top Of Page, and so on) work like column headings in Excel. |
To add a page and specify what goes on it, click Add Page to display the options shown in Figure 10-13. In the Name At Top Of Page list, select the name of the top-level employee you want to appear on the page. In the Number Of Additional Levels list, specify how many of that employee’s subordinates should appear. To include only employees who report directly, choose 1; to include those employees as well as the people who report directly to them, choose 2; and so on. You can also type a page name that will appear on the page tab at the bottom of the drawing window. Click OK to add the page. Add as many pages as you want, and then click Finish to create the organization chart.
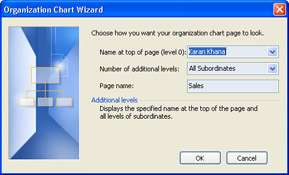
Figure 10-13: To specify where pages break in an organization chart, identify the top-level employee that you want to appear on the new page.
Importing Data from a New File You Create
If you don’t already have a data file, you can use the wizard to create an importable file or work directly with the sample files that Visio provides. Sometimes it’s just easier to enter data in a spreadsheet or text file rather than type names in shapes. If you use the wizard to create a text or Excel file, the wizard opens the appropriate sample file, where you can type your names over the sample data. The wizard stays open while you work. When you exit the sample file, the wizard continues and imports the data.
To use the wizard to create the file, follow these steps:
-
Choose File, New, Organization Chart, Organization Chart Wizard.
-
On the first screen, select the Information That I Enter Using The Wizard option and click Next.
-
Follow the instructions on the screen to create the file and then import it.
| Note | If you have already opened the Organization Chart template, choose Organization Chart, Import Organization Data to start the wizard. |
The organization chart looks too crowded or the spaces
between the shapes are uneven
-
Change the shape spacing Choose Organization Chart, Change Spacing. Choose the Custom option to specify exactly how much space should be between shapes.
-
Change the size of the shapes Choose Organization Chart, Options, and then type values in the Width and Height boxes to specify the size you want to use for all shapes in the chart.
-
Break the organization chart into multiple pages See “Working with Multiple-Page Organization Charts,” page 299.
|
EAN: 2147483647
Pages: 209