Creating a More Complex Pivot Table
In this section, I present VBA code to create a relatively complex pivot table.
Data for a more complex pivot table
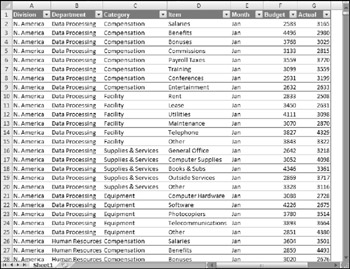
Figure 17-3 shows part of a large worksheet table. This table contains 15,840 rows containing hierarchical budget data for a corporation. There are five divisions, and each division contains 11 departments. Each department has four budget categories, and each budget category contains several budget items. Budgeted and actual amounts are included for each of the 12 months. The goal is to summarize this information with a pivot table.

Figure 17-3: The data in this workbook will be summarized in a pivot table.
| CD-ROM | This workbook is available on the companion CD-ROM. The file is named |
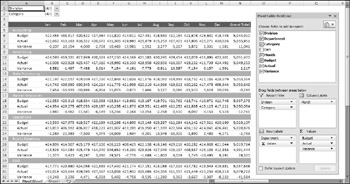
Figure 17-4 shows a pivot table created from the data. Notice that the pivot table contains a calculated field named Variance . This field is the difference between the Budget amount and the Actual amount.

Figure 17-4: A pivot table created from the budget data.
The code that created the pivot table
Here's the VBA code that created the pivot table:
Sub CreatePivotTable() Dim PTcache As PivotCache Dim PT As PivotTable Application.ScreenUpdating = False ' Delete PivotSheet if it exists On Error Resume Next Application.DisplayAlerts = False Sheets("PivotSheet").Delete On Error GoTo 0 ' Create a Pivot Cache Set PTcache = ActiveWorkbook.PivotCaches.Create( _ SourceType:=xlDatabase, _ SourceData:=Range("A1").CurrentRegion.Address) ' Add new worksheet Worksheets.Add ActiveSheet.Name = "PivotSheet" ActiveWindow.DisplayGridlines = False ' Create the Pivot Table from the Cache Set PT = ActiveSheet.PivotTables.Add( _ PivotCache:=PTcache, _ TableDestination:=Range("A1"), _ TableName:="BudgetPivot") With PT ' Add fields .PivotFields("Category").Orientation = xlPageField .PivotFields("Division").Orientation = xlPageField .PivotFields("Department").Orientation = xlRowField .PivotFields("Month").Orientation = xlColumnField .PivotFields("Budget").Orientation = xlDataField .PivotFields("Actual").Orientation = xlDataField .DataPivotField.Orientation = xlRowField ' Add a calculated field to compute variance .CalculatedFields.Add "Variance", "=Budget-Actual" .PivotFields("Variance").Orientation = xlDataField ' Specify a number format .DataBodyRange.NumberFormat = "0,000" ' Apply a style .TableStyle2 = "PivotStyleMedium2" ' Hide Field Headers .DisplayFieldCaptions = False ' Change the captions .PivotFields("Sum of Budget").Caption = " Budget" .PivotFields("Sum of Actual").Caption = " Actual" .PivotFields("Sum of Variance").Caption = " Variance" End With End Sub How the more complex pivot table works
The CreatePivotTable procedure starts by deleting the PivotSheet worksheet if it already exists. It then creates a PivotCache object, inserts a new worksheet named PivotSheet , and creates the pivot table from the PivotCache . The code then adds the following fields to the pivot table:
-
Category: A report filter (page) field.
-
Division: A report filter (page) field.
-
Department: A row field.
-
Month: A column field.
-
Budget: A data field.
-
Actual: A data field.
Notice that the Orientation property of the DataPivotField is set to xlRowField in the following statement:
.DataPivotField.Orientation = xlRowField
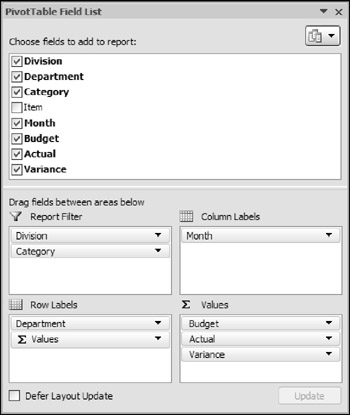
This statement determines the overall orientation of the pivot table, and it represents the Sum Value field in the Pivot Table Field list (see Figure 17-5). Try moving that field to the Column Labels section to see how it affects the pivot table layout.

Figure 17-5: The Pivot Table Field List.
Next, the procedure uses the Add method of the CalculatedFields collection to create the calculated field Variance , which subtracts the Actual amount from the Budget amount. This calculated field is assigned as a data field.
| Note | To add a calculated field to a pivot table manually, use the PivotTable |
Finally, the code makes a few cosmetic adjustments:
-
Applies a number format to the DataBodyRange (which represents the entire pivot table data).
-
Applies a style.
-
Hides the captions (equivalent to the PivotTable Tools
 Options
  Show/Hide
  Field Headers control).
 -
Changes the captions displayed in the pivot table. For example, Sum of Budget is replaced by Budget . Note that the string Budget is preceded by a space. Excel doesn't allow you to change a caption that corresponds to a field name, so adding a space gets around this restriction.
| Note | While creating this procedure, I used the macro recorder extensively to learn about the various properties. That, combined with the information in the Help system (and a fair amount of trial and error), provided all the information I needed. |
EAN: 2147483647
Pages: 319