CISCO IOS ARCHITECTURE FOUNDATIONS
| | ||
| | ||
| | ||
The Cisco IOS architecture is based on the same basic principles employed by the architecture of any general-purpose operating system (OS). The main task of any OS is to control the hardware resources and provide a logical separation between hardware and software operational functionality, so that developers do not have to know much about hardware peculiarities and can use existing functions provided by the OS. However, the IOS architecture is designed particularly for efficient and fast packet processing and forwarding.
The resources of interest to those of us who are concerned with exploit writing and structure are memory and processor time. Because IOS is a multitasking operating system with a monolithic structure (a single large program), we can view it as an application that performs several independent tasks in parallel; together, these tasks form a single stream of executed processor instructions. These instructions are defined as thread , and the streams that use common memory and processor resources are called processes . Since IOS processes comprise a single stream, they are equivalent to threads in other operating systems. Every process has its own memory block ( stack ) and CPU context, such as registers. Since the processor can execute a set of commands of only a single program at a time, the OS has to plan which process will be executed now; this task is handled by the system's kernel.
One of the main tasks of the OS is communication with the CPU and controllers of external interfaces. The OS must process interrupts generated by these interfaces and triggered by external events, execute the operations induced by these interrupts, and then return the processor to the execution of instructions suspended by the interrupt received. Compared to its large desktop and server siblings, the Cisco IOS is quite simple. It lacks various protection mechanisms, such as the protection of separate processes' memory. This means that even though every process does have a separate memory block allocated for it, nothing can stop a process from intruding into a memory block of another process.
Because of this, Cisco has clearly sacrificed both stability and security features in the IOS architecture design to achieve higher productivity and reduce resource consumption.
Cisco IOS Memory Dissection
Let's look at the IOS internals and study in detail the resources of the system that can present interesting challenges for hackers. We are mainly interested in memory, since it serves as the main object of hacking attacks. All IOS memory is projected into a single continuous virtual address space that is divided into regions that usually correspond to different types of physical memory, such as static RAM (SRAM) and dynamic RAM (DRAM). Every memory region is divided into the categories shown in Table 8-1.
| Region | Description |
|---|---|
| Local | Temporary data structures and local heap |
| Iomem | Input/output memory, common for the processor and controllers of network interfaces |
| Fast | A region for tasks for which speed is critical |
| IText | A region for code currently executed by the IOS |
| IData | Storage for the initialized variables |
| IBss | Storage for non-initialized variables |
| Flash | File system, the IOS images' binaries |
| PCI | Peripheral Component Interconnect memory accessible to all devices on a bus |
The following shows the result of executing the show region command on a Cisco 2600 router:
c2600#show region Region Manager: Start End Size(b) Class Media Name 0x03C00000 0x03FFFFFF 4194304 Iomem R/W iomem 0x60000000 0x60FFFFFF 16777216 Flash R/O flash 0x80000000 0x83BFFFFF 62914560 Local R/W main 0x80008098 0x81A08B87 27265776 IText R/O main:text 0x81A08B88 0x8282465B 14793428 IData R/W main:data 0x827804E4 0x8282434B 671336 Local R/W data:firmware 0x8282465C 0x82AF4A9F 2950212 IBss R/W main:bss 0x82AF4AA0 0x83BFFFFF 17872224 Local R/W main:heap
You can see that gaps exist between certain regions. Iomem ends at 0x03FFFFFF of Flash, which starts at 0x60000000. You can view this as an implementation of a basic defense; if the thread starts to write into a free unallocated memory region, it will be stopped .
The structure of a Local memory region (in the show regions output) is shown in Figure 8-1. As you can see, the Local region is divided into subregions that correspond to the parts of the OS (text, data, Block Storage Section [BSS]). The heap is the entire free Local memory after the OS image was loaded into it.
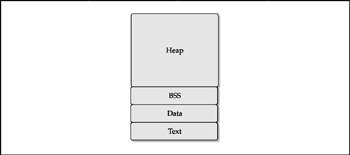
Figure 8-1: Local memory region
In IOS, the memory is organized in memory pools . Each pool is a memory region that can be freed or marked out from the heap. The following shows the result of running the show memory command:
c2600#show memory Head Total(b) Used(b) Free(b) Lowest(b) Largest(b) Processor 82AF4AA0 18543560 5720628 12822932 12629896 12137796 I/O 3C00000 4194304 1764344 2429960 2425168 2429916
Here you can see two marked-out memory pools. Initially, the pool contains one large memory block, but as the memory is handed to processes, the amount of free memory decreases. At the same time, the processes free the occupied memory blocks. Thus, in the process of OS work, memory blocks of different sizes are created (this is called memory fragmentation ), and freed blocks are returned to the pool and added to the list of free blocks of similar size. By default, in accordance with Cisco documentation, the following block sizes (in bytes) are supported: 24, 84, 144, 204, 264, 324, 384, 444, 1500, 2000, 3000, 5000, 10000, 20000, 32786, 65536, 131072, and 262144. When a process asks for memory allocation, the lists are reviewed to find a block of an appropriate size, and if such a block isn't found, memory from larger blocks is used. In that case, the large block is split and the unused memory from this block is added to the block list. Of course, the system tries to defragment memory by merging nearby blocks followed by moving the resulting ones onto the list of larger memory blocks available. All block management tasks in the IOS are done by the Pool Manager process.
To see the list of free blocks in the memory pools, execute the show memory free command:
c2600#show memory free Head Total(b) Used(b) Free(b) Lowest(b) Largest(b) Processor 82AF4AA0 18543560 5721112 12822448 12629896 12137796 I/O 3C00000 4194304 1764344 2429960 2425168 2429916 Processor memory Address Bytes Prev Next Ref PrevF NextF Alloc PC what 24 Free list 1 82B19668 0000000056 82B19634 82B196CC 000 0 82FFD4FC 8065FF5C (fragment) 82FFD4FC 0000000024 82FFD4BC 82FFD540 000 82B19668 8304165C 8039A9DC (fragment) 8304165C 0000000056 8304161C 830416C0 000 82FFD4FC 0 8039A9DC (fragment)
-
Address is the starting address of a block.
-
Bytes are the block size.
-
Prev is an address of the previous block.
-
Next is the address of the next block.
-
Ref is the number of the block owners , which equals 000 if the block is free.
-
PrevF is the address of the previous free block (for free blocks only).
-
NextF is the address of the next free block (for free blocks only).
-
Alloc PC is the value of the command counter register at the moment of a block allocation.
-
what is a description of the block usage.
This information makes it apparent that the blocks are linked with each other, and means that the neighboring blocks point at each other, as illustrated in Figure 8-2.
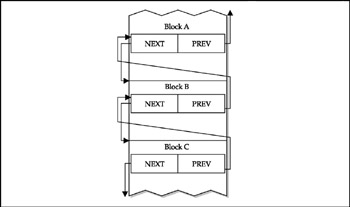
Figure 8-2: Memory block linking
The only information we found in the official Cisco documentation regarding IOS memory blocks is that the management information about the block is stored in a 32-byte block header. The research of FX, a pioneer of Cisco exploitation and a well-known creator of working proof-of-concept IOS exploits related to memory allocation implementation errors (buffer overflows), comes in handy. In Figures 8-3 and 8-4, you can see FX's description of the memory blocks organization, drawn from his multiple presentations devoted to Cisco IOS exploitation.
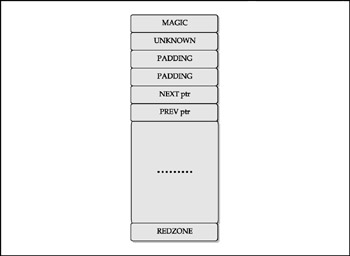
Figure 8-3: Free memory block
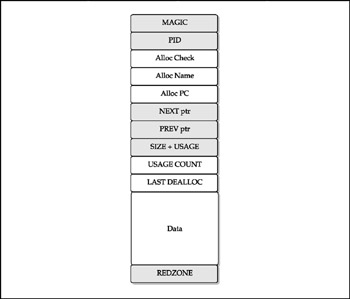
Figure 8-4: Process memory block
As you can see in Figures 8-3 and 8-4, both memory block constructions start from the MAGIC value that marks the beginning of the block header. This is a static value that equals 0xDEADBEEF for a free block and 0xAB1234CD for a used one. Both free and used blocks have the same trailer REDZONE and a static value of 0xFD0110DF, which signifies the block end. In a used block, you can see the IOS process ID (PID)the very same PID that is seen in the show processes command output:
c2600#show processes CPU utilization for five seconds: 0%/0%; one minute: 1%; five minutes: 0% PID QTy PC Runtime (ms) Invoked uSecs Stacks TTY Process 1 Cwe 80434F9C 0 2 0 5800/6000 0 Chunk Manager 2 Csp 80460574 16 66323 0 2628/3000 0 Load Meter 4 Mwe 805E17C4 4 2765 1 5784/6000 0 DHCPD Timer 5 Mwe 80E52090 4 1 400023540/24000 0 EDDRI_MAIN 6 Lst 80444AE8 238323 39289 6065 5768/6000 0 Check heaps 7 Cwe 8044A984 0 2 0 5712/6000 0 Pool Manager 8 Mst 803867F0 0 2 0 5592/6000 0 Timers 9 Mwe 8001492C 0 2 0 5596/6000 0 Serial Background 10 Mwe 80359C3C 0 2 0 5588/6000 0 AAA high- capacity
Just after the PID comes the Alloc Check area, which allocates the process use for checks; the Alloc Name pointer to a string with the process name; and the Alloc PC-Code address that allocates this block. The information about these fields can be obtained by adding the allocating-process option to the show memory processor command:
c2600#show memory processor allocating-process Processor memory Address Bytes Prev Next Ref Alloc Proc Alloc PC What 82AF4AA0 0000020000 00000000 82AF98EC 001 *Init* 80432EF4 Managed Chunk Queue Elements 82AF98EC 0000010000 82AF4AA0 82AFC028 001 *Init* 804468B0 List Elements 82AFC028 0000005000 82AF98EC 82AFD3DC 001 *Init* 804468F0 List Headers 82AFD3DC 0000000044 82AFC028 82AFD434 001 *Init* 819FFFB8 *Init* 82AFD434 0000001500 82AFD3DC 82AFDA3C 001 *Init* 80451D50 messages 82AFDA3C 0000001500 82AFD434 82AFE044 001 *Init* 80451D7C Watched messages 82AFE044 0000005912 82AFDA3C 82AFF788 001 *Init* 80451DC8 Watched Boolean 82AFF788 0000000092 82AFE044 82AFF810 001 *Init* 8062411C Init 82AFF810 0000004256 82AFF788 82B008DC 001 *Init* 8038FF20 TTY data 82B008DC 0000002000 82AFF810 82B010D8 001 *Init* 80393678 TTY Input Buf
Looking further at the memory block in Figure 8-4, you can see two familiar entries used in a free block (Figure 8-3), namely NEXT BLOCK and PREV BLOCK. As in a free block, these entries represent the addresses of the next and previous memory blocks the difference being that in a free block, only the addresses of other free blocks are used. In a process memory block, these are the addresses of the literal next and previous blocks.
We mentioned that Cisco IOS memory blocks are double-linked (see Figure 8-2). The next 2-bytes long field of the block is SIZE+USAGE. It consists of the actual block size, and if the block is used the most significant bit is set to 1. The USAGE COUNT field follows the SIZE, and the actual value of this field is the Ref in the show memory processor allocating-process command output. The amount of processes using this block is usually 1 or 0. Then follows the LAST DEALLOC(ation) address field, at which the header ends and the data begins.
The header of a free block is, of course, simpler, and FX doesn't pay much attention to it. The padding field of a free block is padded with 0xFF bytes. The significance of the UNKNOWN field was not investigated by FX, and for our purposes, it is probably unimportant. It is interesting to note, though, that the memory blocks are somewhat similar to the network protocols' packets by their structure.
| | ||
| | ||
| | ||
EAN: 2147483647
Pages: 117