DESIGNING TO FIT NEEDS
You'd be surprised how many internetworks-even big sophisticated ones-have grown haphazardly. Unmanaged network growth occurs for any number of reasons. The most common one is that things simply happened too fast. Keep in mind the realities we now take for granted-client-server computing, intranets, the Web, extranets-were mere concepts until the last decade. This left many IT managers unprepared to formulate well-researched, reasoned strategic network plans for their enterprises.
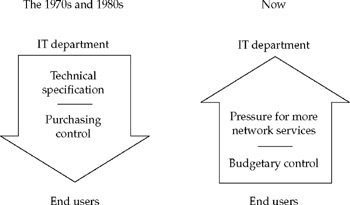
In many cases, a plan wouldn't have done much good. Management fads come and go, but one fad that stuck is the credo "If I pay, then I have the say." The management trend has been toward flat organizational structures, with minimum layers between the CEO and worker. Most IT departments are now "budgeted" by individual divisions, groups, or even departments. In other words, IT decisions are increasingly being made from the bottom up by the entity that owns the budget, not the central IT department.

This kind of distributed decision-making has been magnified by the slowness of many IT departments to respond to emerging customer demands driven by such things as business process reengineering, mergers, acquisitions, and trading partner cooperatives. So it got to the point where many end-user managers simply threw out the corporate technical architecture, picked up the phone, and ordered new networks on their own.
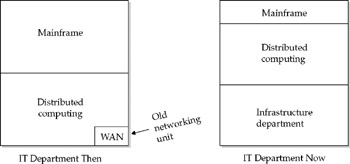
The trend over the last several years has been for IT departments to break off networking into a separate group called infrastructure-separate the chip heads from the wire heads, so to speak. This is being done because internetworking has simply become too big and too complicated to be left to a manager who, say, has a background in COBOL and mainframe software project management. Networking is its own game now. It is fast becoming its own discipline with its own set of best practices-some of which we'll review in the remainder of this chapter.

Methodologies have been developed to help bring network planning under control. Not surprisingly, these bear a strong resemblance to data processing methodologies. First and foremost, of course, is to fit the solution to the business needs through some form of needs assessment-both present and future.
Understanding Existing Internetworks
As mentioned earlier, few network designs start from scratch. Although it would be nice to work from a blank sheet of paper, most designs must accommodate a preexisting network. Most are incremental redesigns to serve more users or to upgrade bandwidth capacity, or both. A common upgrade, for example, is to insert a layer of routers between the LAN backbone and the layer at which hosts access the network. This is being done in many enterprises to improve performance and accommodate projected growth. Whatever the change, the preexisting infrastructure must be thoroughly analyzed before even considering a purchase.
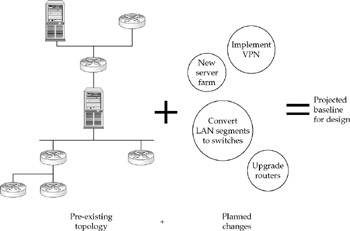
The next section describes methods for network planning and design. They focus on establishing a baseline of how the network will look upon implementation. To refresh on the subject, a baseline is a network's starting point, as expressed in traffic volumes, flows, and characteristics. Allowances are made for margins of error and projected growth over and above the baseline.

When designing an entirely new network area, you must arrive at a design baseline based on well-researched assumptions, often derived from paperwork or other nonnetworked data traffic already in place. If an existing network topology is being upgraded, the baseline is taken by measuring its characteristics. If the design scenario encompasses non-networked and networked elements, then the two must be compiled together. Whatever the case, the principles and methods of good network design remain the same.
Characterizing Networks
There are several methods for understanding an internetwork well enough to formulate a proper design. These methods apply whether it's an existing internetwork or a topology to be built from scratch. As you might expect, the methods focus on geography and traffic-in other words, where network nodes are and what travels between them. A network node is any device in the topology-including network devices, such as routers, and payload hosts, such as servers. For our purposes, when designing a network from scratch, a node could be a noncomputer entity such as a desk or a file cabinet. The point is to identify where the users are and what they're using.
Quality of Service
Characterizing networks is good for managing as well as designing. The industry is pushing the concept of Quality of Service (QoS)-an approach largely based on characterizing traffic. QoS is the technique of assuring throughput for traffic through an internetwork. It is more sophisticated than just guaranteeing that a certain link will run at a certain throughput level. Most QoS guarantees are associated with a particular type of traffic, say, prioritizing video multicasting for distance learning over e-mail and other less critical traffic.
As you might imagine, QoS policy implementation relies heavily on information gathered through SNMP and RMON, and presented through NMS consoles, such as Resource Manager Essentials and Campus Manager. Like those console applications, QoS uses the client-server model by storing a QoS database, and it implements policies through purpose-built applets, such as QoS Policy Manager, QoS Distribution Manager, and Cisco Assure.
Cisco's QoS Policy Manager creates abstract commands that group individual IOS commands to perform a task from the Cisco Policy Manager GUI. As with other NMS console applets, when you push a button, one or more commands are put to use on the client network device being configured. Some QoS subcommands are generic IOS commands (the interface command, for example); others are QoS-specific. The major QoS abstract commands are as follows:
-
WFQ Stands for Weighted Fair Queuing. Combines the interface and fair-queue commands to let network managers prioritize how a mix of traffic types will flow through certain areas of the topology. For example, e-mail might be given a higher priority on Lotus Notes servers, but not elsewhere.
-
WRED Stands for Weighted Random Early Detection. Combines the interface and random-detect commands. (The random-detect command accepts a weighted value to represent the relative importance of a traffic type.) WRED tries to control traffic congestion as it begins to emerge.
-
CAR Stands for Committed Access Rate. CAR is the fundamental QoS bandwidth control technology. It uses a sophisticated RMON MIB to recognize traffic types, set priorities, and limit packet rates as needed.
QoS techniques are mostly applied at the network interface level, and make heavy use of access control lists to filter packets. The idea is to differentiate traffic types within topology areas and influence network behavior-a technique dubbed traffic shaping. The goal of traffic shaping is to guarantee minimum levels of end-to-end service for various types of traffic.
Understanding Traffic Flow
Understanding and documenting traffic flow is the first step in network design. Drawing an analogy to highway design might seem too obvious, but the two are remarkably similar. A road designer must know where the roads should be, how wide, covered with what type of surface, and what traffic control rules are to be applied. All these things are largely a function of traffic flow.
Traffic characteristics are largely a matter of directionality, symmetry, packet sizes, and volumes. A unidirectional flow does most communicating in one direction; a bidirectional flow communicates with roughly the same frequency in both directions of a connection. An asymmetrical flow sends more data in one direction than the other; a symmetrical flow sends roughly equal amounts of data back and forth. For example, an HTTP session's flow is bidirectional and asymmetric because a lot of messages are sent both ways, but data is mostly downloaded from the Web server to the browser client.
Identifying Traffic Sources To understand traffic flow, you must know its sources. This is done by identifying groups of users, not individual persons. In the parlance of computer methodology, a group of users is often called a community (probably because the obvious term, user group, is already used by customer associations-for example, the Cisco User Group).
An inventory of high-level characteristics, such as location and applications used, should be gathered. This isn't to say that one would go around with a clipboard gathering the information. Most network designers would pull this information off a database from such tools as Resource Manager Essentials or Campus Manager. The following example shows a form that might be used to gather user information:
| Community | # Persons | Locations | Applications | Host Type |
|---|---|---|---|---|
| Accounting | 27 | St. Louis | AR, AP, GL | AS/400 |
| Customer Service | 200 | Minneapolis | Call Center | Windows NT 4.0 |
You can gather whatever information you want. For example, you might not want to document the type of host the group uses if everybody has a Pentium PC. On the other hand, if there's a mix of dumb terminals, thin clients, PCs, and souped-up UNIX/LINUX workstations, you might want to know who has what. This information can help you more accurately calculate traffic loads.
If you're analyzing an existing network, this information can be gathered by turning on the record-route option in IOS. This information can also be gathered using Resource Manager Essentials or Campus Manager.
Identifying Data Sources and Data Sinks Every enterprise has major users of information. The experts identify these heavy data users as data sinks because it's useful to trace back to the data sources they use to help identify traffic patterns. The most common sources are database servers, disk farms, tape or CD libraries, inventory systems, online catalogs, and so on. Data sinks are usually end users, but sometimes servers can be data sinks. The following illustration shows information to gather on data sinks.
| Data Sink | Locations | Applications | User Communities |
|---|---|---|---|
| Server farm 3 | St. Louis | AR, AP, GL | Accounting |
| CCSRV | Denver | Call Center | Customer Service |
Documenting which communities use each data sink enables you to correlate traffic. You can now begin connecting user desktop hosts to data sink servers. Combining the information in the preceding two illustrations lets you begin drawing lines between client and server. Correlate every user community to every data sink, and an accurate profile of the network's ideal topology begins to emerge.
Identifying Application Loads and Traffic Types Most network applications generate traffic with specific characteristics. For example, FTP generates unidirectional and asymmetric traffic involving large files. Table 14-1 is a sampling of typical message types and their approximate sizes. Obviously, sizes can vary widely, but these are industry rules of thumb useful for estimating traffic loads.
| Message Type | Approximate Size |
|---|---|
| Web page | 50 KB |
| Graphical computer screen (such as a Microsoft Windows screen) | 500 KB |
| | 10 KB |
| Word processing document | 100 KB |
| Spreadsheet | 200 KB |
| Terminal screen | 5 KB |
| Multimedia object (such as videoconferencing) | 100 KB |
| Database backup | 1 MB and up |
Beyond traffic loads, it's also useful to know the traffic type. Traffic types characterize the kinds of devices connected and how traffic flows between them:
-
Client-server Usually a PC talking to a UNIX/LINUX or Windows server, this is the standard configuration today. In client-server types, traffic is usually bidirectional and asymmetrical.
-
Server-to-server Examples include data mirroring to a redundant server backing up another server, name directory services, and so on. This type of traffic is bidirectional, but the symmetry depends on the application.
-
Terminal-host Many terminal-based applications run over IP, even IBM terminal connections to mainframes. Another example is Telnet. Terminal traffic is bidirectional, but symmetry depends on the application.
-
Peer-to-peer Examples include videoconferencing and PCs set up to access resources on other PCs, such as printers and data. This type of traffic is bidirectional and symmetric.
Understanding what types of traffic pass through various links gives a picture of how to configure it. The following illustration shows information used to identify and characterize traffic types.
| Application | Traffic Type | User Community | Data Sinks | Bandwidth Required | QoS Policy |
|---|---|---|---|---|---|
| Web browser | Client-server | Sales | Sales server | 350 Kbps | CAR |
| TN3270 | Terminal | Purchasing | AS/400 | 200 Kbps | WRED |
Frequently, a link is dominated by one or two traffic types. The Bandwidth Required column in the preceding illustration is usually expressed as a bit-per-second estimate and could be Mbps or even Gbps. Once all the applications in an internetwork are identified and characterized, the designer has a baseline from which to make volume-dependent configuration decisions. Traffic typing is especially useful for knowing where and how to set QoS policies. In other words, you must identify which applications go through a router before you can properly set QoS parameters in its config file.
Understanding Traffic Load
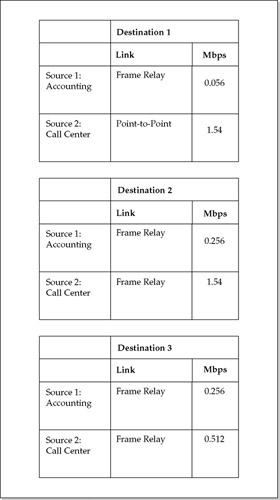
After the user communities, data sinks and sources, and traffic flows have been documented and characterized, individual links can be more accurately sized. The traffic flow information in the following illustration ties down the paths taken between sources and destinations.

Designing internetworks to fit needs is more art than science, however. For example, even after having totaled the estimated bandwidth for a link, you must go back and pad it for soft factors, such as QoS priorities, anticipated near-term growth, and so on.
EAN: 2147483647
Pages: 102