Debugging Stored Procedures
| One of the most powerful tools exposed by the Server Explorer is the ability to step through an executing stored procedure. I call this T-SQL debugging. This technology has been around in Visual Basic and Visual Studio for some time now, but with a very checkered career. As the story goes, Drew Fletcher (a Visual Basic program manager) was walking near Times Square in New York when a man tried to get his attention from the shadows of a dark alley. "Hey, buddy!" he whispered in a gravely voice. "Youse want a way to debug stored procedures from Visual Basic?" Drew kept walking. He had heard about the nuts that hang out in the alleys off of 42nd Street and didn't need any extra adventure in his life. "Don't believe me?" the man persisted as he tailed Drew down the street close behind. "Beat it!" Drew half-shouted as he glanced over his shoulder. Fortunately, he recognized the stranger at oncehe was a Microsoft Consulting Services engineer that worked in the local office. To make a long story short, the MCS people in New York had been able to create a working prototype of a Visual Basic application that could actually debug and step through a stored procedure. What they didn't tell Drew is that this magic required DDE[3] to work. Over the years, the protocol changed as often as some engineers change their socks (or more frequently). That was the big problemgetting SQL Server to permit an attached development system to interact with the execution of the stored procedure without killing the system or other production work in progress.
Today remote debugging has been implemented with yet another protocol. Hopefully, it works better than previous versions. Given that it has taken several wasted hours before finally being able to get it to work, I'm not so sure they have made much progress. At this point, some developers wish that Drew had kept walking and visited that guy up 42nd Street with the coat lined with "authentic" Rolex watches. T-SQL Debugging Against a Local InstanceWhen T-SQL debugging works, being able to set breakpoints in stored procedures can dramatically improve your chances of figuring out what your stored procedure is and is not doing. The problem with this technology is that it can be especially hard to set up unless you're running Visual Studio 2005 on the same system as the SQL Server executing the stored procedure. To make things as clear (and safe) as possible, I'm going to try to lead you through this snake- and gator-infested swamp, so stay close together. Incidentally, T-SQL debugging is available only on the Professional or Team editions, so if you're working with the Express or Standard editions, you can only press your nose to the glass and watch. Tip Debugging Stored Procedures is available only on Professional and Team editions. As I said, if you're trying to debug a stored procedure running on a local SQL Server (an instance running on the same system as Visual Studio 2005), it's easy (easier) to debug your stored procedure. Let's step through the process:
Debugging with Breakpoints Within Stored ProceduresBefore you start debugging more complex stored procedures (those with more than a couple blocks of code), you're going to want to set one or more breakpoints. Just as when setting breakpoints in Visual Basic .NET or C# code, Visual Studio stops execution at the top line of the stored procedure code block containing the breakpointassuming you're not executing the application with the "Execute" option as previously described. To get execution to stop on a breakpoint, you'll need to execute the stored procedure using ADO.NET in debug mode or interactively in Visual Studio using the "Step Into Stored Procedure" option. While Visual Studio 2005 has several new features that make it easier to debug stored procedures, it's still missing some important functionality, but I'll talk about that a bit later. Setting a breakpoint is as easy as setting code breakpoints in Visual Studiosimply click on the left (gray) margin next to the point where execution should be paused. Breakpoints are indicated by a red ball in the margin, as shown in Figure 5.16. Figure 5.16. Setting a breakpoint in a stored procedure.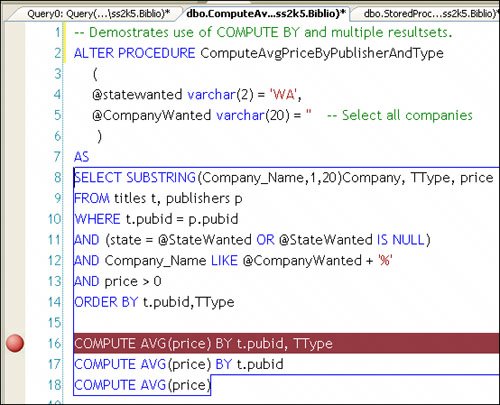
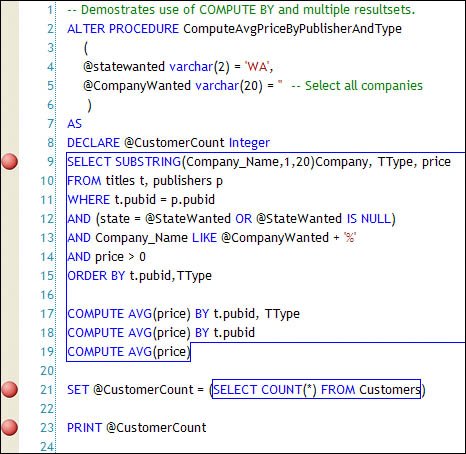
If you set a breakpoint in a stored procedure, the breakpoints are persisted with the Visual Studio IDE, so when that stored procedure is reopened, those breakpoints are restored. For this exercise, I'm going to set T-SQL breakpoints in a stored procedure from the Biblio database (ComputeAvgPriceByPublisherAndType), which computes average book price by publisher and state.
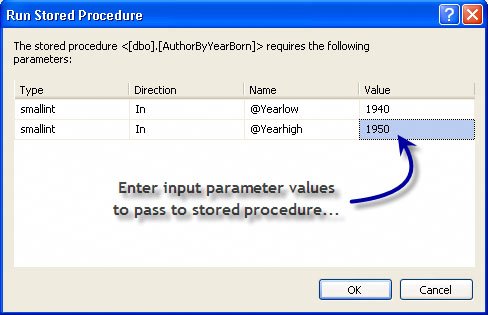
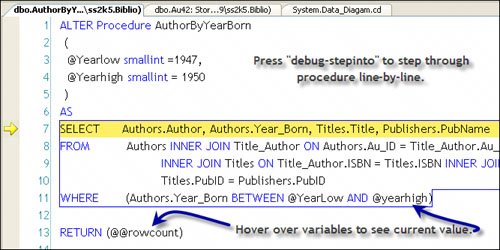
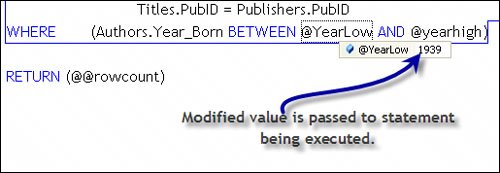
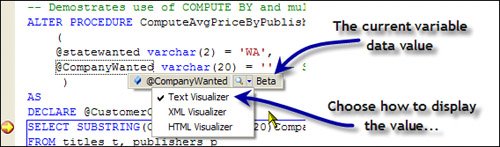
Setting Multiple BreakpointsLet's take a look at another aspect of step-through debugging. Set additional breakpoints on the stored procedure as shown in Figure 5.17. Figure 5.17. The CompteAvgPriceByPublisherAndType stored procedure after a few additions. In this example, I set breakpoints on lines 9, 21, and 23. Now when I choose "Step Into Stored Procedure", code execution pauses at line 9. When I press F5, execution pauses again at line 21. While paused, I can hover over any of the input parameters or local variables (such as @CustomerCount) to see the current values.
At this point, I've shown you how to step through a T-SQL stored procedure and set breakpoints on stored procedures running on a local instance of SQL Server. I'm ready to show you how to do the same from a "remote" (non-local) SQL Server instance. |
EAN: 2147483647
Pages: 227