The Query Optimizer and the Query Plan
| Someone could write a whole book on how the SQL Server Query Optimizer (QO) generates a query plan, but there isn't the space here so I'll just hit the high pointsthe rest would probably put you to sleep anyway. The query plan is simply the program (the series of steps) SQL Server runs to perform the work specified by the T-SQL query. The query plan is generated automatically the first time SQL Server encounters the query and does not find a cached plan left over from the last time the query was executed. It's important to know how the QO builds the query plan, so I'll provide enough information here to help you write T-SQL that the QO can use to build an efficient query planone that works each time the query is executedregardless of the parameters passed with the query. Consider that T-SQL is a programming language like any other. Just like any other computer language compiler, SQL Server must convert your T-SQL query string into a number of low-level operations to locate, sift, filter, and sort the data you ask for. These basic operations include:
Viewing and Tuning the Query PlanThe SQL Server Management Studio query editor can also be used to show the query's execution plan. I'm going to use the query I built for Figure 2.27. While it's pretty simplistic, if you click on the "Display Estimate Query Plan" button, you'll see a graphical layout of the execution plan (as shown in the Execution Plan tabbed window in Figure 2.67). This is a great way to forecast how well your query will run. As you make changes to the TSQL, you can watch the plan adapt to these changes. Figure 2.67. A simple execution query plan.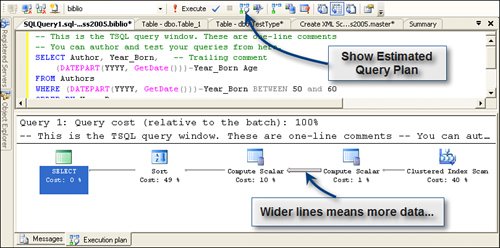 Note that the first step in the plan is a Clustered Index Scan (the step farthest to the right), which takes about 40% of the time to execute. The two Compute Scalar steps take about 11%, but the sort takes about 49%. Perhaps we could make this query faster by removing the ORDER BY clause and depending on a client-side sortin other words, let the UI element (like a DataGridView control) sort the returned rowset. You can also choose to show the actual query planthis is a new feature for SQL Server 2005. The actual plan is based on the parameters passed to the query at execution timewhich can materially affect the query strategy generated by the server. We use the estimated and actual query plans to help design stored procedures and other queries that have to perform well no matter what parameters are passed to them. Another point to note is that the same query executed in SQL Server 2000 builds a different query plan (as shown in Figure 2.68). Notice how the sort is done before executing the scalar and how much more time (relative to the other parts of the plan) is consumed by the Clustered Index scan (the first step). Figure 2.68. SQL Server 2000 Query Analyzer query plan estimate when executing the same query.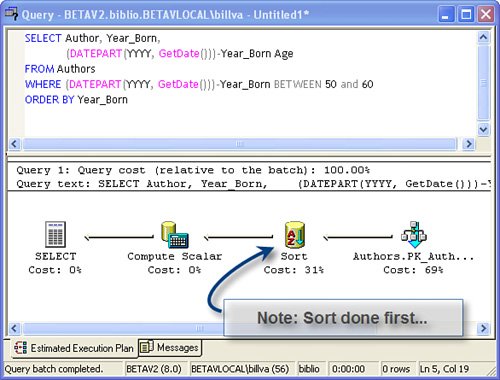 Examining Client Statistics and Alternate PlansAnother way to better understand what the server is doing when it's executing the query is to study the client statistics. This feature was in SQL Server 2000 Query Analyzer, but you had to add a few lines of T-SQL[22] to your query to enable them. The new SQL Server Management Studio is far better. Consider the simple query I just executed. If I remove the ORDER BY clause and reexecute the query with the "show client statistics" option enabled, I'm presented with a new tab "Client Statistics", shown in Figure 2.69.
Figure 2.69. Client Statistics Tab showing multiple "trials".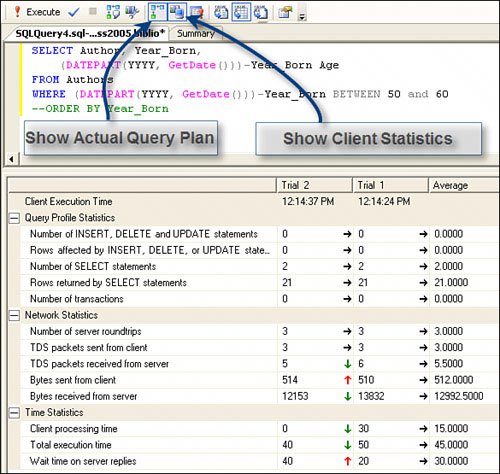 Notice that there are two "trials" shown. Each time you execute a query when the Show Client Statistics button is depressed, SQL Server records the statistics and compares these results with the previous trial. It also shows (using arrows) where the results did not change or were lower or higher. Notice that in trial 2 (where we removed the ORDER BY clause), the total execution time dropped by 25% (from 50 to 40), and the amount of client processing time dropped from 30 to 0. It does not take a rocket scientist to tell this analysis can be very valuable as you try to determine how to best tune your query or stored procedure. Management Studio also supports the Database Tuning advisor that can analyze how SQL Server is accessing your database and whether or not your indexes are being used efficiently. It can actually make the corrections for you, if necessary. Using the Query Options | General tab (shown in Figure 2.70), you can also set the default rowcount (we recommend you set this to about 50), a smaller TEXTSIZE (10K should be plenty), and a finite execution time-out (90 seconds should be more than enough). Figure 2.70. Setting Query Options on the Execution | General options page.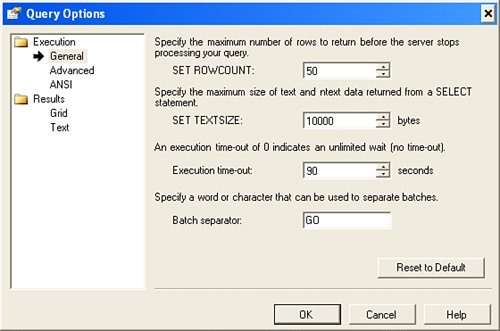 Another helpful feature is the way that SQL Server Management Studio has exposed its Query Options page. By selecting the Execution | Advanced options page (shown in Figure 2.71), you can choose a wealth of options that are implemented for each query you executewithout having to add T-SQL. Figure 2.71. The SQL Server Management Studio Query Options page showing the Execution | Advanced options.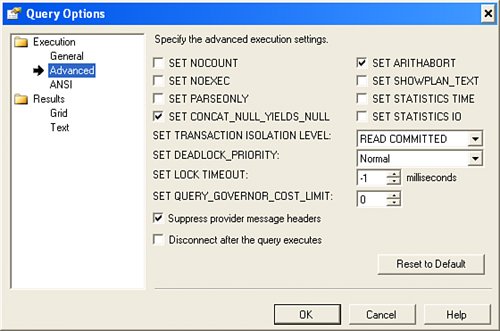 You can see the query plan built by SQL Server by using Management Studio against virtually any query. Here is a query plan for a query that's a bit more complex, as shown in Figure 2.72. In this case, I've opened a query window in SQL Server Management Studio, entered a T-SQL JOIN query and clicked the Display Estimated Query Plan option button on the SQL Editor toolbar. Figure 2.72. A query plan as displayed by "Display Estimated Query Plan". If you hover the cursor over one of the query operations, Management Studio exposes a detail dialog that shows what low-level operations were done by the chosen operation. Note the thickness of the arrowsthicker arrows mean proportionately more data must move over this path while processing the plan. As you hover over these arrows, you're informed of the exact number of I/O operations performed at that stage. In the process of building the query plan, SQL Server's QO takes into account any existing table indexes that could help locate the data rows requested or to sort the data at one phase or another of the plan. The QO also uses database "statistics" to determine the best query plan. Statistics are sophisticated maps of the data that SQL Server automatically maintains behind the scenes. Using these statistics, the QO can determine how the data is distributed in the table. These help determine whether a particular query would be more efficiently executed using one or more indexes (an Index Scan or Clustered Index Scan) or by simply scanning each row in the table (a Table Scan) as it looks for rows that qualify for your query. Yes, a query can actually execute more quickly by stepping through each row in a large table instead of walking through one or more indexes to access the rows. For example, if your WHERE clause is missing or so ambiguous to encompass most of the table, it makes more sense to simply process all of the rows in the table. Index operations require two separate stepsone to locate the appropriate index (page) and another to fetch the data page the index addresses.
SQL Server stores its data on 8K "pages" that contain as many rows as will fit. Pages are stored in "extents" and a database can have many, many extents. When SQL Server accesses the data, it usually loads an entire page in memory at once from disk to save time. Another important point here is that the QO compiles the entire T-SQL query when it builds a query planit does not "shortcut" the plan based on in the T-SQL logic. The QO does, however, factor in the values of parameters passed into the query, so in some cases, two similar T-SQL queries might return very different query plans (and perform very differently) when you use different parameters or use different arguments in the query. As your T-SQL queries become more complex, the QO has to take more and more time trying to figure out a viable query plan the first time an uncached query is encountered. After a while, it simply gives up and uses brute force to execute the query. You don't want this to happen. When you graduate to more sophisticated T-SQL queries, you can provide "hints" to the QO to "encourage" it to use one type of query plan strategy over another. When you're ready to do that, I can point you to a few books that discuss this in more depth. I also talk about writing efficient queries throughout the bookespecially when I start discussing writing and executing stored procedures. IMHO Think more, smaller, not fewer, and larger when creating stored procedures. Note that SQL Server 2005 introduces statement-level recompilation of stored procedures. When SQL Server 2005 recompiles stored procedures, only the statement that caused the recompilation is compiled rather than the entire procedure. As a result, SQL Server uses the parameter values as they exist in the recompiled statement when regenerating a query plan. These values may differ from those that were originally passed into the procedure. Executing the Query PlanOnce SQL Server has built a query plan, it's executed by one or more "worker threads" on the server. This means that several threads of execution can work on your query at oncein parallel. As the first few rows (the first few kilobytes of data) are returned from the query plan's program, they're held in a buffer on the server, and the client is notified that SQL Server is ready to transmit the results of the query. SQL Server waits until it receives notification that the client has begun to accept the processed rows. As the client (your ADO code) starts fetching the rows, the server tries to keep ahead by finding more rows to return to the client and buffering them on the server. When the last row is found by SQL Server and fetched by ADO, a final TDS packet is built that contains the rows affected count, the RETURN value, and any OUTPUT parameters (if you're executing a stored procedure). The rows affected value reflects how many rows were found by the query or were changed by an action query (like an INSERT, UPDATE, or DELETE). Nope, you can't get to the rows affected count or the other returned parameters before the rows are sentthat's because SQL Server does not know the final count until it finishes finding all qualifying rows.
It's also possible (but dangerous) to ask SQL Server to "cancel" an in-process operation. If you choose to do this, SQL Server attempts to stop what it's doing, but it won't do anything that it thinks will compromise the database integrity. In some cases, this might mean that one or more operations are "undone" or rolled back. When the query plan has been completed, the connection is reset by SQL Server and you can execute another query. At least, that's how SQL Server has worked since its inception. SQL Server 2005 now permits the same connection to be used for more than one query at the same time. This technology is called "Multiple Active ResultSets," or MARS. I'll talk about the limitations and rules when using MARS in Chapter 9. |
EAN: 2147483647
Pages: 227