| Okay, we're ready to check out another technique to monitor SQL Server and the SqlClient .NET Data Provider. Sure, you can also monitor about a bazillion other performance counters besides those exposed by SQL Server and ADO.NET. Unfortunately, working with performance counters can be problematic. First, there is an entire set of counters that should not be usedthose created for the 1.0 version of the frameworkbecause they never have worked correctly. I'll show those to you a bit later. Let's get started by using the Windows Performance Monitor to monitor activity on our selected SQL Server instance. | | 1. | Start the Windows Performance MMC snap-in from the Start | All Programs | Administrative Tools menu. This opens the Performance application, which, by default, starts to display the status of three performance counters: Memory Pages/Sec, PhysicalDisk Avg. Disk Queue Length, and Processor % Processor Time. A snapshot of these counters is taken once per second, and their value is drawn on three graphs shown in Figure III.7.
Figure III.7. The Performance monitor's default configuration. 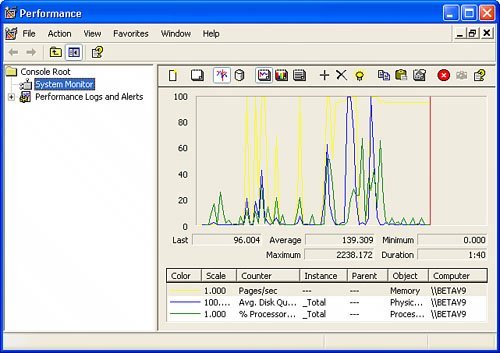
| | | 2. | After removing these three counters (by clicking on the "X" button at the top of the window for each counter to delete), I clicked on the "+" to open a selection dialog where I can choose other Performance counters to monitor. This dialog can take a few seconds to load, so be patient. Let's start by choosing the ".NET Data Provider for SqlServer" counters from the dropdown list, as shown in Figure III.8. Do not select the .NET CLR Data countersthey're busted and won't be fixed.
Figure III.8. Selecting a set of Performance counters. 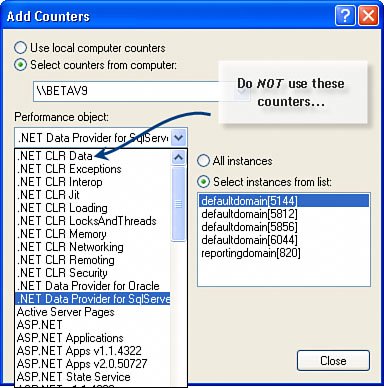
| | | 3. | Okay, once you choose a set of counters, the next (fairly important challenge) is knowing which instance to choose. These "instances," shown in the right-hand ListBox in Figure III.8, are really connections through the SqlClient .NET data provider. No, if you don't have any active connections open, this list will be empty. For the moment, let's sidestep that issue. The Add Counters dialog should now look something like Figure III.9.
Figure III.9. Selecting a specific Performance counter to monitor. 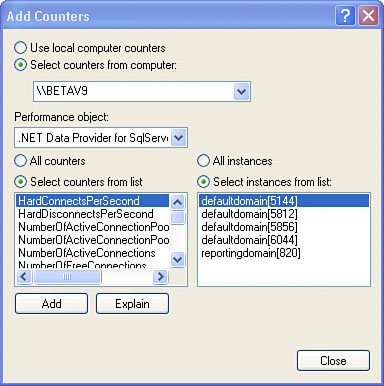
| | | 4. | If you click "Add" at this point, you're telling the Performance application to start monitoring data from the selected Performance counter as generated by the selected instance(s). That's coolright up to the point where the connection is closed. That's when the SqlClient Performance counter code starts throwing exceptions each time its referencedonce a second, in this case. If the connection is re-established, the instance number changes as a new connection is created. This makes these SqlClient counters not as usefulbut there are more counters from which to choose. At least they don't affect the behavior of the connection pool like the old 1.0 counters.
| 5. | Browse through the list of exposed Performance counters shown in the ListBox on the left. All of these pertain to ADO.NET connectionsno other ADO.NET metrics are exposed. No, not all of the counters are exposed in this listand they won't be until you tell your ADO.NET (via the ConnectionString) that it's okay to return the values. That's because some of these counters (as I describe later) are very expensive to compute, so they can affect performance.
|
Before I drill into the SqlClient Performance counters, consider that SQL Server and its related services expose a wealth of Performance counters. These include one or more counters (usually a dozen or more) exposed by Integration Services (BCP/SSIS), Native XML Web Services, OLAP, Notification Services, Reporting Services, Replication Services, and a host of Performance counters exposed by SQL Server itselfas well as many others too numerous to mention[1] In this same vein, SQL Server General Statistics: Logical Connections is especially useful when monitoring the state of the connection pool. [1] See "Using SQL Server ObjectsMonitoring Resource Usage (System Monitor)" in BOL.
The ADO.NET SqlClient Performance Counters After the (ah, to be kind) debacle created by the 1.0 ADO.NET Performance counters, Microsoft decided to start over and create a whole new set of counters that return basically the same informationand a bit more for the 2.0 release. Let's hope these hold up better. Nope, these counter names are not localized, but duh, that would be really tough to support. I've listed these in Table III.1. Table III.1. SqlClient ADO.NET Performance countersPerformance Counter | What It Counts... |
|---|
HardConnectsPerSecond | Connections per second made to specified connection instance. | HardDisconnectsPerSecond | Connections per second made to specified connection instance. | NumberOfActiveConnectionPoolGroups | Unique active connection pool groups. Controlled by unique connection strings in the AppDomain. | NumberOfActiveConnectionPools | The total number of connection pools (see Chapter 9, "Getting Connected"). | NumberOfInactiveConnectionPoolGroups | Unique connection pool groups marked for pruning. Controlled by unique connection strings in the AppDomain. | NumberOfInactiveConnectionPools | Inactive connection pools without recent activity and waiting to be disposed. | NumberOfNonPooledConnections | Active unpooled connections. | NumberOfPooledConnections | Active connections managed by the connection pooler. | NumberOfReclaimedConnections | Connections reclaimed through garbage collection where Close or Dispose not called by the application. | NumberOfStasisConnections | Connections currently awaiting completion of an action; therefore, unavailable for use. | SoftDisconnectsPerSecond | Active connections being returned to the connection pool. | *The following counters are not enabled by default. I show how to enable them in this section. | NumberOfActiveConnections* | Active connections. | NumberOfFreeConnections* | Connections available for use in connection pools. | SoftConnectsPerSecond* | Active connections pulled from the connection pool. |
Activating "Special Case" Performance Counters The aforementioned (*) counters consume more resources than the others, and the SqlClient provider won't populate them unless you add the following element to your application configuration file (as shown in Figure III.10). Figure III.10. Add this element to your application's app.config file. 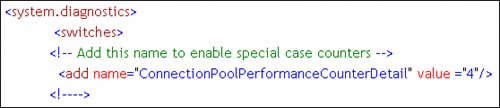
When wiring up each of these counters, you'll need to provide a valid "instance" that's tied to the process ID of the application that "owns" the connection pool. Remember, each process or app domain (in an ASP application) gets its own connection pool. If the application ends, any applications monitoring the connection pool instance must be prepared for the inevitable exceptions. If you do anything in any application that monitors Performance counters, you need to ensure that your exception handlers are ready for lost connectivity to the selected instances. I've included a sample application that monitors and exercises the connection pool and uses both SQL Server and SqlClient Performance counters. See "PoolMonitor Using Performance Counters" on the DVD. This application "owns" the connection pool it creates, which makes it easier to capture the instance namethe code in Figure III.11 shows how this is done. Figure III.11. Capturing the ProcessID and determining the instance name of the connection pool. 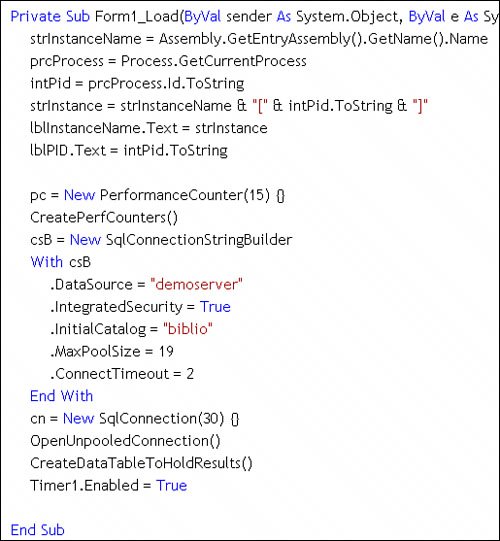
|