Chapter 4: Cause Analysis
Introduction to Cause Analysis
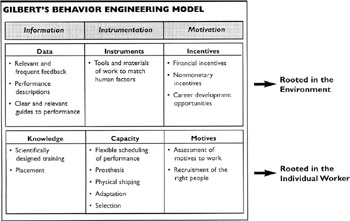
Cause analysis is the second step in the HPT Model (Figure 4-1) and is based on Thomas F. Gilbert's Behavior Engineering Model [1] (see Table 4-1). Although thorough performance analysis yields valuable information about the organization, the environment, and performance gaps, a cause analysis will determine why the performance gap exists. This section of the chapter will provide the reader with an overview of cause analysis. The remaining sections will focus on six performance gap causes that are rooted in either the environment or the individual worker.
| |
 |
| |
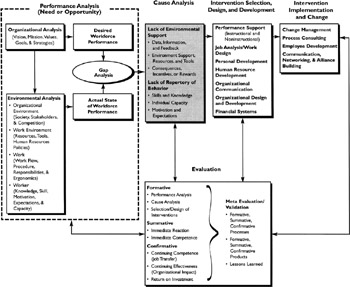
Figure 4-1: HPT MODEL ” CAUSE ANALYSIS PHASE
Definition and Scope
"Cause analysis is the process of determining the root cause(s) of past, present, or future performance gaps. It follows , but is integrally related to, performance analysis." [2] Rosenberg sees cause analysis as the bridge between performance analysis and the appropriate intervention(s) that will eliminate the performance gap. [3] Using the roots-of-a-tree analogy, he tells us "to look under the performance gap to discover its roots ... select intervention(s) ... to both feed the high performance roots and eliminate the roots that caused the performance gap." [4]
Robinson and Robinson, in linking training to business needs, say that cause analysis "provides us with the data to respond to either of these two questions: What is causing an end-result and/or on-the-job performance deficiency? What might prevent newly learned skills from being transferred to the job?" [5]
Historically, theorists like Robert Mager, Peter Pipe, Thomas Gilbert, Geary Rummler, Alan Brache, and Joe Harless suggest that performance problems are essentially deficiencies of knowledge, skills, training, or a host of management deficiencies. [6] Allison Rossett identified four kinds of drivers (e.g., causes, barriers, or obstacles): lack of skill, knowledge, and information; flawed incentives, flawed environment; tools and processes; and lack of motivation. [7] She defined drivers as "everything that it takes to enable performance to 'grow.'" [8] Robinson and Robinson identified three major causes of performance deficiencies: those due to the learner, those due to the manager (boss) of the learner, and those due to the organization. [9] Perhaps the most influential listing of performance gap causes comes from Gilbert's work on human competence, especially his Behavior Engineering Model, above. [10]
Rothwell and Dean have adapted the Behavior Engineering Model to guide the PT practitioner in the search for causes (see Table 4-2). [11] , [12] They focus on performance drivers, asking key performance questions and suggesting examples of performance deficiencies.
| Performance Drivers (or Causes) | Performance Questions | Performance Deficiency Examples |
|---|---|---|
|
|
|
|
|
|
|
|
|
|
|
|
|
|
|
|
|
|
Conducting a Cause Analysis
Too often PT practitioners are overly confident in their diagnostic abilities , and they jump from performance analysis to intervention selection before thoroughly understanding the cause(s) of the performance gap. Symptoms are often disguised as causes. Without a solid understanding of cause analysis and how it affects work, workers, and workplace, the choice of interventions is flawed. Cause analysis determines why the performance gap exists and how it affects the unique mission, needs, wants, and desires of the organization. Once the cause of a performance problem is known, the PT practitioner can choose the appropriate intervention(s).
Techniques
The following steps can be used to conduct a cause analysis of a performance gap:
-
Identify the driver or cause of the performance gap.
-
Classify the driver or cause by determining where it originates within Rothwell's classification of the environment of human performance: [13]
-
Organizational environment
-
Work environment
-
Work
-
Worker
-
-
Prioritize the driver or cause according to high or low impact on the performance environment.
-
During cause analysis it is important to generate as many cause examples as possible. This gives the opportunity to look at many sides of the problem. If either skills or knowledge is identified as a cause, the example list may include these: employee has forgotten how to use the skill, doesn't have adequate information, lacks training in specific processes and procedures, doesn't know the components of the system, etc. If consequences, incentives, and rewards are identified, the example list may read: poor performance is rewarded, no management planning exists, competing incentives send mixed messages, etc.
-
The PT practitioner should also verify causes and corresponding examples with clients. Ask who, what, when, where, and why questions, and involve them ” clients may shed light on the topic and client support and buyin are necessary for the next phases of the HPT Model.
Tools
There are a variety of tools employed for conducting cause analysis. Table 4-3 illustrates cause analysis tools suggested by Rossett [14] and Rothwell. [15]
| Name of Tool | Brief Description |
|---|---|
|
|
|
|
|
|
|
|
|
|
|
|
|
|
| [a] Rothwell, 1996b, p. 170 [b] Rothwell, 1996b, pp. 170 “171 [c] Rothwell, 1996b, pp. 171 “173 [d] Rothwell, 1996b, p. 173 | |
In addition to these tools, flowcharts, histograms, Pareto charts, and run charts are useful for identifying causes of performance gaps. [16]
[1] Gilbert, T. E, 1978, pp. 88 “92
[2] Rothwell, 1996a, p. 79
[3] Rosenberg, 1996a
[4] Rosenberg, 1996a, p. 380
[5] Robinson and Robinson, 1989, p. 109
[6] Rothwell, 1996b, pp. 153 “154
[7] Rossett, 1999, pp. 32 “37
[8] Rossett, 1999, p. 38
[9] Robinson and Robinson, 1989
[10] Gilbert, 1978, p. 88
[11] Rothwell, 1996b, pp. 13 “14
[12] Dean, 1997, pp. 45 “51
[13] Rothwell, 1996b, p. 33
[14] Rossett, 1992
[15] Rothwell, 1996b
[16] Rothwell, 1996b
EAN: 2147483647
Pages: 98