15.2 Storage subsystem
|
| < Day Day Up > |
|
The storage subsystem and the distribution of disks play an important part in the overall performance of any system. In the case of Oracle databases, the appropriate sizing, stripe widths, and the appropriate placements of files, etc., are also very important.
In Chapter 2 (Hardware Concepts) we discussed that redo log files should be isolated from the rest of the data files. Since redo log files are write-intensive and have no read activity, they would be configured on RAID 1 type storage systems.
In a RAC configuration, this takes another important twist, because each instance maintains its own copy of the redo log files. When configuring the redo logs files in a RAC configuration, not only should the redo log files be isolated from the data files, they should also be isolated from the redo log files of the other instances.
During allocation of disks and storage areas, and while creating data files, it is important to isolate data files that belong to hot tables, or tables that are highly transaction oriented, from other similar files.
From the operating system, the iostat is a good measure to determine disk activity. The STATSPACK report also indicates and helps to determine hot table spaces so that they can be moved to appropriate storage areas.
OEM provides certain GUI-based views of the disk utilization. The disk utilization chart in Figure 15.1 is a good example of the information available from OEM. The chart indicates that the activity on the various disks is not distributed; certain disks are busy, while there is absolutely no activity on the other disks. Good rule-of-thumb guidelines for distributing I/O are:
-
Separate redo log groups on different disks.
-
Separate members of a group on different disks.
-
Separate data files and redo log files on different disks.
-
Separate (or stripe) table data on different disks.
-
Separate tables and indexes on different disks.
-
Store temporary segments on different disks.
-
Store undo segments on different disks.
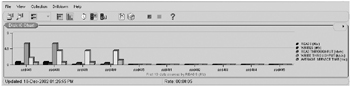
Figure 15.1: OEM disk utili zation chart.
Similarly, the output generated from the I/O activity screen provides the overall I/O on any specific instance. Figure 15.2 indicates that the peak I/O activity is mostly reads on the systems and averages between 800 and 1800 reads per second.
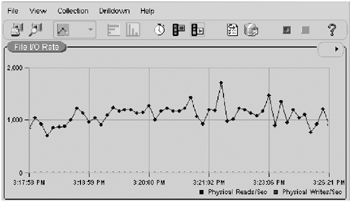
Figure 15.2: OEM file I/O rate chart.
Oracle provides dynamic views that can be queried to determine the hot data files. For example, the following query provides a list of data files and their I/O activity:
COL NAME FORMAT A45 SELECT NAME, PHYRDS, PHYWRTS, AVGIOTIM FROM V$DATAFILE DF, V$FILESTAT FS WHERE DF.FILE# =FS.FILE# / NAME PHYRDS PHYWRTS AVGIOTIM -------------------------------------- ------- ------- -------- /dev/vx/rdsk/oraracdg/partition_1G3 976 16 0 /dev/vx/rdsk/oraracdg/partition_3G2 23 1283 0 /dev/vx/rdsk/oraracdg/partition_1G16 3 0 1 /dev/vx/rdsk/oraracdg/partition_1G13 4799 267 0 /dev/vx/rdsk/oraracdg/partition_3G9 3 0 1 /dev/vx/rdsk/oraracdg/partition_1G44 35 0 0 /dev/vx/rdsk/oraracdg/partition_1G45 4 0 0 /dev/vx/rdsk/oraracdg/partition_1G47 4 0 1 /dev/vx/rdsk/oraracdg/partition_1G12 308 0 0 /dev/vx/rdsk/oraracdg/partition_1G14 4 0 1 /dev/vx/rdsk/oraracdg/partition_1G17 4 0 0 NAME PHYRDS PHYWRTS AVGIOTIM -------------------------------------- ------- ------- -------- /dev/vx/rdsk/oraracdg/partition_1G10 276 0 0 /dev/vx/rdsk/oraracdg/partition_1G15 156 0 0 /dev/vx/rdsk/oraracdg/partition_1G18 4 0 0 /dev/vx/rdsk/oraracdg/partition_1G4 148 0 0 /dev/vx/rdsk/oraracdg/partition_1G5 148 0 0 /dev/vx/rdsk/oraracdg/partition_1G6 1444 0 0 /dev/vx/rdsk/oraracdg/partition_500m1a 691 0 0 /dev/vx/rdsk/oraracdg/partition_200m3 140 0 0 /dev/vx/rdsk/oraracdg/partition_200m4 92 0 0 /dev/vx/rdsk/oraracdg/partition_200m5 14 0 0 /dev/vx/rdsk/oraracdg/partition_200m6 12 0 0
The view displays the I/O for the server processes, the DBWR process, and the LGWR process. Since the output is gathered from Oracle-provided dynamic views, the I/O activities do not reflect those not initiated by the Oracle server. Therefore, the output from this script should be analyzed in combination with an O/S utility such as iostat to investigate whether the relocation of the database or the competing files is necessary.
The AVGIOTIM column in the above query helps identify any disks that are processing requests at obviously higher or lower rates than others. This helps movement of files to the disks with the most appropriate speeds based on the contents.
If data files have been isolated and distributed and the redo log files have been distributed, but there continues to be a significant number of I/ O related issues, then thought should be given to the indexing, partitioning, and data distribution factors of the application. Similarly, looking at the speeds of the actual physical disks could also be helpful.
|
| < Day Day Up > |
|
EAN: 2147483647
Pages: 174