Debugging
Because no programmer is perfect, part of all development involves testing and debugging code. There are thousands of techniques for debugging code. This section will cover some of our favorite techniques, which range from general bug prevention practices to the use of specific debugging tools such as Microsoft Visual Interdev.
Error Prevention and Tracking
There is an old adage that the best offense is a good defense. In the world of coding, the best way to have error-free code is to prevent errors in the first place. Following are some useful techniques for avoiding errors and finding them once they occur.
- Name variables appropriately. It is easy to access the wrong variable if you use names like S11 and S12, instead of strFirstName and strLastName.
- Use formatting to make your code easier to read. Indenting code can help you see which code is part of a loop or which <TD> tags belong with which rows.
- Create small, reusable functions. Small functions make it easier to isolate problems, and the more reusable code you use, the less new code you will have to test.
- Use descriptive comments liberally. Comments help explain what the programmer intended each part of the code to do.
- When possible, place script in the head of a Web page. This ensures that the code is loaded before any of the objects in the body. So, for example, functions and event-handling code are loaded before objects in the body that might call them.
- Anticipate and code for unusual or unexpected states when writing your code. For example, if code from one frame calls on an object in another frame, test to make sure the target frame is loaded before trying to access its object. Such defensive coding can greatly increase stability.
- Include error-handling code that prevents the user from ever realizing an error occurred. Such techniques will be covered later in the chapter.
- Use tools that help you write clean code. Editors like Microsoft Visual Interdev and Allaire HomeSite will color-code your script, making different types of tags different colors and coloring everything between quotes. This can help you find common mistakes such as forgetting to end a tag with an angle bracket or omitting a quote or curly bracket in script. These tools also can automatically handle indenting and can generate code for common functions. Visual Interdev and Microsoft Script Debugger contain debugging features to help track down problems. Tools are described in more detail later in the chapter.
- Make sure you are given as much error information as the browser can supply. Microsoft Internet Explorer 5 supports Developer mode, an option that displays script error messages on screen (described in the Note on the next page). Previous versions of Internet Explorer automatically displayed a lot of error information on screen. Netscape provides the Communicator Console for debugging information. It can be displayed by typing javascript: into the Location field in Navigator.
- Use comments to help isolate problem code. If you think a line of script is causing an error, comment it out by inserting two forward slashes at the beginning of the line. Test problematic HTML by surrounding it with HTML comment tags (<!-- and -->).
- Use techniques to track the values of variables and the state of different objects as the script is processed. These will be discussed next.
NOTE
Error messages are presented differently in different browsers. Internet Explorer 5 alerts the user that an error has occurred by displaying a message in the status bar at the bottom of the window. If the user double-clicks on the error notification in the status bar, the full error window appears. In some browsers, the error immediately displays on screen in a dialog box. Internet Explorer 5 can be configured to do this by checking the "Always display this message when a page contains errors" option in any error dialog box, or by checking the "Display a notification about every script error" option in the Tools menu under Internet Options/Advanced. This configuration is known as the "Developer mode" of error display and is highly recommended.
Visible Variables and Run-Time Coding
When working with code, it is often useful to know the values of certain variables or the state of a particular object. It can also be useful to create and run code after the page has been loaded. Code Listing 10-1 demonstrates several ways to accomplish these tasks. Figure 10-1 displays the results.
Code Listing 10-1.
<HTML> <HEAD> <TITLE>Listing 10-1</TITLE> <SCRIPT LANGUAGE="JavaScript"> function doIt(){ a=10 window.status=("a="+a) b=20 alert("b="+b) c=a+b } </SCRIPT> </HEAD> <BODY onload="doIt()"> <FORM NAME="frmDbg" onsubmit="eval(this.sDbg.value);return false"> <INPUT TYPE="text" NAME="sDbg" SIZE="50"> <INPUT TYPE="button" onclick="eval(frmDbg.sDbg.value)" VALUE="Run Code"> </FORM> </BODY> </HTML> |
There are many ways to determine the status of different components of your code. One technique is to display information about the component in the Alert dialog box or in the Status bar at the bottom of the browser window. To change the Status bar contents, simply set a value for window.status. If you are using Internet Explorer version 4 or later as your test platform, you can also create a named <SPAN> tag and then change the innerHTML property of the span to display the error in the document itself.
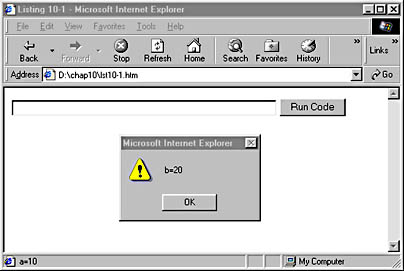
Figure 10-1. Several ways to debug.
Typically, it is useful to distinguish debugging code from the surrounding program code so that you don't forget to remove it before finalizing your development. An easy way to make debugging code stand out from other code is to not indent it. A more sophisticated method is to have a "debugging mode" for your page. For example, a variable named debug can be set to true or false. Conditional loops are set up around all of the debugging code that test the debug variable and run the debugging code only if debug is set to true.
A second technique in Code Listing 10-1 uses the text field. Any code that is typed into the text field will be evaluated when you press the Enter key or click the Run Code button. Use this technique when you do not know ahead of time what type of information you will be interested in once the page has loaded. Any valid JScript can be typed into the field for evaluation. For example, if you enter alert(window.location), an Alert dialog box containing the path to the current document will be displayed. If you enter alert(window.navigator.userAgent), information about the browser in use will be displayed.
Script Debugging Tools
Tools such as Script Debugger, Visual Interdev, and Netscape JavaScript Debugger are designed specifically to debug and analyze scripting code. Script Debugger is free and available with extensive documentation from msdn.microsoft.com/scripting. Script Debugger provides debug information for pages created with JScript, VBScript, and Java applications. It enables you to
- Step through the script line by line or set break points to pause the script
- Display and change the values of script variables and object properties
- Debug Active Server Pages on servers running Microsoft Internet Information Services Web server
Script Debugger requires the developer's workstation to have installed Internet Explorer version 3.02 or later. Once Script Debugger is installed, it can be accessed from the View menu inside Internet Explorer or automatically launched from within script by using the keyword "debugger." A major limitation of Script Debugger is its inability to edit and debug the script within the same window.
Netscape JavaScript Debugger is a somewhat similar product. It can be found at http://developer.netscape.com/software.
Visual Interdev is a powerful development environment for rapidly creating Web applications. It is an excellent tool for creating both standard Web pages and database-driven server-side applications. Visual Interdev has built-in debugging and page analysis tools. It incorporates all of the features of Script Debugger and includes such additional features as
- Comprehensive server- and client-side debugging tools for stepping through code and watching variables
- A window that displays all attributes for a selected HTML tag
- Integrated database tools that make creating database-driven applications easy
- WYSIWYG editing
- Tree control representation of the page and scripts on the page
- Easy drag-and-drop use of ActiveX controls
We highly recommend Visual Interdev for anyone creating applications with both server- and client-side components, especially those involving database connectivity.
EAN: 2147483647
Pages: 128