Starting Crystal Reports
|
To start Crystal Reports, select Start, Programs, Crystal Reports x (where x is your version of Crystal Reports). When you perform these steps, a Crystal Reports screen displays (complete with some familiar user interface elements such as toolbars and menu bars). Users are also greeted with a Welcome dialog box.
Figure 2-1 displays the Crystal Reports Welcome dialog box.
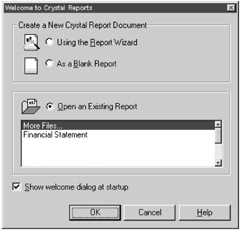
Figure 2-1: The Crystal Reports Welcome dialog box
You can use the Welcome dialog box to perform three main types of functionality:
-
Create a new report with the Report Wizards
-
Create new reports from scratch
-
Open an existing report
| Tip | If you want this dialog box to display every time you start Crystal Reports, check the Show welcome dialog at startup check box. |
Crystal Reports provides two ways to build new reports. You can create a report from scratch, starting with nothing more than a blank page. You can also use one of the Report Wizards (covered in Chapter 4), which walk you step-by-step through the process of report design.
For now, let's just start a blank report so you can familiarize yourself with the tools of the trade. Select the As a Blank Report option button, and press the OK button. A Report Designer screen displays, followed by the Database Expert dialog box.
Working with the Database Expert
Crystal Reports' Database Expert allows you to select the location of the data and the database tables that you use within your reports. Figure 2-2 displays the Database Expert.
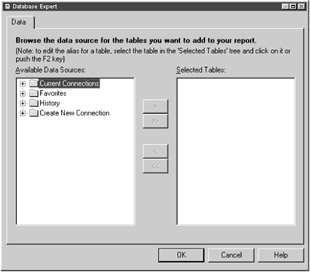
Figure 2-2: The Database Expert dialog box
The Database Expert allows you to select a variety of data sources supported by Crystal Reports. These data sources are categorized into different folder nodes, with collapsible plus signs next to the folders. The folders represent the following database categories:
-
Current Connections: This folder contains a list of already-existing data source connections. You won't find any connections the first time you expand this node.
-
Favorites: This folder contains a list of data sources that you commonly use and have added to your Favorites list.
-
History: This folder contains a list of the last five data sources that you've used.
-
Create New Connection: This folder contains a list of sub-folders, representing the different data sources to which you can connect. These subfolders (as shown in Figure 2-3) are summarized in Table 2-1.
Table 2-1: Create New Connection subfolders Subfolder
Description
Access/Excel (DAO)
This folder creates a connection to a Data Access Object (DAO) data source.
A Data Access Object is a data access interface that communicates with Microsoft Jet and ODBC-compliant data sources. DAO allows users to connect to and retrieve data from applications that use the Jet engine, including most Microsoft Office applications like MS-Word, MS-Access, and Excel.
ACT! 3.0
This folder creates a connection to data created within Symantec's ACT! contact management software. Crystal Reports can read this ACT! data, allowing you to create reports based on your contact information.
You can create connections to earlier versions of ACT! (prior to version 3) by using a file called Crw.act. To use this file, you will need to access it from the Database Files folder. Check with your system administrator for connecting to versions of ACT! prior to version 3.
Crystal Queries
This folder creates a connection to a Crystal SQL Designer (.qry) file.
A Crystal Query file allows users to take a quick and easy look at a database (in other words, there is no formatting done to the data). You learn more about Crystal Queries in Chapter 15.
Database Files
This folder creates a connection to a local PC-style database, such as Microsoft Access. This is the type of connection that you use for the purposes of this book.
Dictionary/Infoview
This folder creates a connection to a Crystal Dictionary (.dc5) file or a Crystal Infoview (.civ) file.
A Crystal Dictionary file is a simplified view of a database, often useful to those unfamiliar with the complexity of their database. Crystal Dictionaries are useful, but they must first be created by one familiar with the database layout.
A Crystal Infoview is a file that controls the tables, fields, and records that can actually be seen from a database and is often used to prevent access of classified or prohibited information.
ODBC (RDO)
This folder creates a connection to a Remote Data Object data source.
A Remote Data Object (RDO) is an object-oriented data access tool, used only with databases complying with the most recent ODBC standard. ODBC (which stands for open database connectivity) is a program used to connect to popular databases.
Most corporate databases (such as Oracle and Microsoft SQL Server) support this type of connection.
OLE DB (ADO)
This folder creates a connection to an ActiveX Data Object data source.
An ActiveX Data Object (ADO) is an interface to the application programming interface known as Object Linking and Embedding Database (OLE DB). OLE DB accesses all kinds of data files on a computer network.
More Data Sources
This folder allows users to create a connection for the following data sources: Borland Database Engine, Btrieve, CDO, Field Definitions, File System Data, Outlook, and xBase.
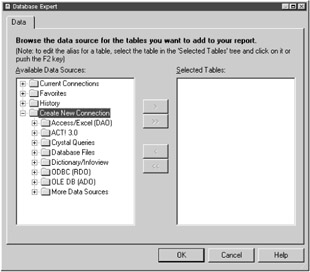
Figure 2-3: Data connection options of the Database Expert
Knowing the method of data connection can be tricky, it depends a lot on the type of data source from which you're reporting. Should you have questions about the connection to your real-world data-base, check with your system administrator. He or she will know best the correct method of how to access system data.
Creating a Data Connection to the Sample Database
In this book, you use a sample database provided with the Crystal Reports software. This database, xtreme.mdb, is a Microsoft Access database, with all the necessary drivers included with the Crystal Reports installation. You can use the database and begin designing reports immediately, even if you don't have Microsoft Access installed on your computer.
The xtreme.mdb database contains data about a mountain bike and accessory company. The data is an excellent model for real-world business activities and is useful in learning to develop usable reports.
To select this tutorial database, perform the following steps:
-
Start up Crystal Reports (if you haven't done so already).
-
At the Welcome dialog box, select the As a Blank Report option.
-
Click the OK button. The Database Expert dialog box displays.
If the Database Expert dialog box is not displayed, go to the menu bar and select Database, Database Expert.
-
Within the Database Expert dialog box, expand the Create New Connection folder.
If no items are found, you can double-click the folder. An Open dialog box displays, allowing you to search.
-
Expand the Database Files folder and perform a search for the xtreme.mdb sample database.
You can perform a search by double-clicking the Find Database File option.
By default, the xtreme.mdb database is located in the \Program Files\Crystal Decisions\Crystal Reports 9\En\ Samples\Databases directory. This file is placed onto your computer during the Crystal Reports install.
-
Double-click the xtreme.mdb database from the default location.
Voil — you've made a connection to a data source! Your screen should look like Figure 2-4.
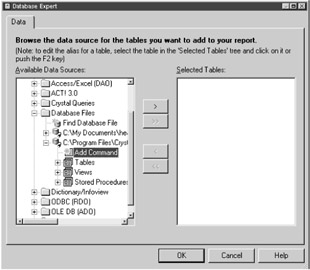
Figure 2-4: Selecting the sample database with the Database Expert
| Note | To add a data source to the Favorites folder, first connect the data source (as you did in the steps above). Right-click on the data source when you see it in the Database Expert. A dropdown options menu displays. Select the Add to Favorites option from this menu. The data source is now available within the Favorites folder. |
After selecting your database, you usually begin selecting the database tables to use within your report. However, for now don't worry about selecting any tables or other database objects (you'll get your fair share of this in the next chapter). Press the OK button. You'll find yourself looking at the Report Design/Preview area.
Exploring the Report Design Area
The Report Design area (shown in Figure 2-5) is where most of your Crystal Reports development takes place. In this area, you select and format the objects that make up your report.
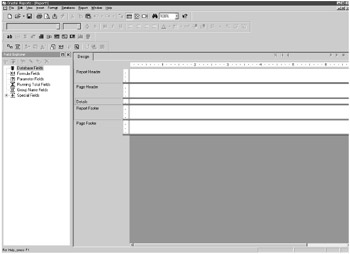
Figure 2-5: The Report Design area
Crystal Reports, like many report designing programs, uses a "banded" approach for designing reports. Each band (referred to in Crystal Reports as sections) reflects a particular type of content for the report. The following list summarizes the five sections used within Crystal Reports:
-
Report Header: This section is generally used for the report title and other information that you want displayed on only the first page of a report (such as a company logo or a chart created from the report's data).
-
Page Header: This section generally includes information at the top of every page in your report (such as descriptive labels that appear above your report data).
-
Details: This section is where the body of the report occurs. It's here that all the retrieved data displays. This is the body of the report. This section prints once per record.
-
Report Footer: This section is similar to the Report Header section. Information contained here displays only once at the end of the report. This section is used to display grand totals.
-
Page Footer: This section is similar to the Page Header section. This section displays information at the bottom of every page of the report and is often used for page numbers.
Although these sections may seem confusing, they make more sense once you begin your report development.
Working with the Menu Bar
Perhaps the first thing you noticed on the Report Design screen was the menu bar — that rectangular bar displayed at the top of the screen as shown in Figure 2-6. The menu bar contains several drop-down options that represent different functionality you can use when designing your reports.
![]()
Figure 2-6: The Crystal Reports menu bar
Table 2-2 summarizes the different menus available within Crystal Reports.
| Menu | Description |
|---|---|
| File | This menu contains functionality such as opening, closing, and saving files, sending files to a printer, and creating new reports. This menu also contains additional options, such as setting page margins, exporting a report to a variety of file formats, adding summary information to the report, and customizing Crystal Reports' features to meet your personal preferences. |
| Edit | This menu allows you to modify your reports, including undo and redo action and cut/copy/paste/delete functionality. This menu also contains additional functionality, such as changing subreport links. |
| View | This menu allows you to modify Crystal Reports' user interface, as well as define which areas of this interface are to remain visible or hidden. |
| Insert | This menu allows you to add report objects, totals, groups, and subreports into your reports. This menu also provides the options to add additional reporting features, such as charts, maps, and graphics. |
| Format | This menu allows you to change the look of elements within a report. These options include formatting various report objects, including charts and cross-tab reports. This menu also contains options that allow Crystal Reports to automatically arrange your report objects and apply template styles to your report. |
| Database | This menu allows you to utilize information from a database. Here you can add or delete the tables you wish to use in your report, define how various database tables link together, and browse the data within a table's field. |
| Report | This menu allows you to select the records or groups to include within a report, including grouping and sorting functionality, as well as creating formulas to use within your reports. |
| Window | This menu allows you to rearrange buttons and windows, as well as list what report windows are currently open. |
| Help | This menu allows you to access Crystal Reports' online help. The online help contains a variety of technical information and user questions related to Crystal Reports and report development. |
| Tip | While all the menus are useful, you'll find that the most widely used are the View, Insert, Database, and Report menus. |
Using the Crystal Reports Toolbars
Directly under the menu bar is a series of selectable buttons, better known as a toolbar. A toolbar is a block of on-screen buttons. When clicked with a mouse, these buttons activate some of the most widely used menu options. Toolbars provide another method of selecting some of the drop-down options found within the menu bar.
Crystal Reports contains four toolbars: Standard, Formatting, Insert Tools, and Expert Tools. Each is summarized in the following sections.
| Note | You can turn on or off the Crystal Reports toolbars by selecting View, Toolbars from the menu bar. When you select this option, a Toolbars dialog box displays with a check box next to each of the toolbars. A checked check box means that the toolbar displays; an unchecked check box means the toolbar does not display. Use these check boxes to control which toolbars you wish to view. |
Exploring the Standard Toolbar
The Standard toolbar (shown in Figure 2-7) contains buttons (such as Find, New, and Save) that are identical to buttons in several Windows programs. The Standard toolbar contains shortcuts to some of Crystal Reports' most widely used functionality.
![]()
Figure 2-7: The Standard toolbar
| Tip | If you can't remember what a button stands for on any of the toolbars, try activating the Content Help tool. To activate this tool, select Help, Content Help from the menu bar. Your Content Help tool is now activated. Rest your cursor pointer over a button. When Content Help is activated, a small label displays, explaining the name of the button. To deactivate this tool, return to the Help, Content Help option within the menu bar. Simply unselect the option, and the Content Help will deactivate. |
The following table summarizes the buttons available on the Standard toolbar.
| Button | Label | Shortcut Key | Description |
|---|---|---|---|
| | New | Ctrl+N | Creates a new report. |
| | Open | Ctrl+O | Opens an existing report. |
| | Save | Ctrl+S | Saves new changes. |
| | | Ctrl+P | Sends the report to the printer. |
| | Print Preview | Displays a preview of the report. | |
| | Export | Exports the report to one of several popular file formats. | |
| | Refresh | F5 | Updates the report with new data. |
| | Cut | Ctrl+X | Removes an object from the report, storing it in your computer's clipboard application. |
| | Copy | Ctrl+C | Copies an object from the report, storing it in your computer's clipboard application. |
| | Paste | Ctrl+V | Places an item cut or copied onto the report (retrieving this object from the clipboard application). |
| | Undo | Ctrl+Z | Enables users to return objects to a previous state by undoing the effects of an action. This key enables you to "undo" mistakes. |
| | Redo | Ctrl+Y | Redoes the last action that was previously undone. |
| | Group Tree | Activates (or deactivates) the Group Tree. The Group Tree enables you to drill down on groups to view the details of the underlying data. | |
| | Field Explorer | Opens the Field Explorer dialog box, enabling users to insert database fields into a report. | |
| | Report Explorer | Opens the Report Explorer dialog box, enabling users to view the contents of the report in a tree view. | |
| | Repository Explorer | Activates the Repository Explorer, which enables you to view the contents of the repository. The repository contains report objects you can use within your current report. | |
| | Find | Enables users to find a specific record. | |
| | Zoom Control | Sets the magnification factor for viewing reports. | |
| | Help | Activates the Content Help tool. |
Exploring the Formatting Toolbar
The Formatting toolbar (shown in Figure 2-8) resides underneath the Standard toolbar and contains many self-explanatory buttons that you've probably seen in other applications, often associated with controlling the format of the objects within your report. For example, the Formatting toolbar allows you to control the size and style of your fonts, the alignment of text, and how many decimal places display within numerical information.
![]()
Figure 2-8: The Formatting toolbar
The following table summarizes the buttons available on the Formatting toolbar.
| Button | Label | Description |
|---|---|---|
| | Font face | Changes the type of font used by a report object. |
| | Font size | Changes the size of a font used by a report object. |
| | Increase font size | Increases a report object's text one point each time the button is pressed. |
| | Decrease font size | Decreases a report object's text one point each time the button is pressed. |
| | Bold | Changes a report object's text to boldface. |
| | Italics | Italicizes a report object's text. |
| | Underline | Underlines a report object's text. |
| | Align left | Aligns a report object's text flush left. |
| | Align center | Centers a report object's text. |
| | Align right | Aligns a report object's text flush right. |
| | Align justify | Aligns a report object's text evenly along both the left and right margins of a column. |
| | Font color | Applies a chosen color to the selected report object. |
| | Outside borders | Applies a chosen border to the selected report object. |
| | Suppress | Hides a report object. |
| | Lock format | Locks the formatting of the selected report object. |
| | Lock size/position | Locks the size and positions of a selected report object in relation to an adjacent report object. |
| | Currency | Places a currency symbol next to a report object that is a number (or currency) data type. |
| | Thousands | Places a thousands separator within a report object that is a number (or currency) data type. |
| | Percent | Places a percent sign next to a report object that is a number (or currency) data type. |
| | Increase decimals | Adds one decimal place to a report object that is a number (or currency) data type. |
| | Decrease decimals | Removes one decimal place from a report object that is a number (or currency) data type. |
Exploring the Insert Tools Toolbar
The Insert Tools toolbar (shown in Figure 2-9) resides underneath the Formatting toolbar. The Insert Tools toolbar contains shortcuts for adding a variety of report-enhancing features, such as text objects, groups, subreports, charts, and maps. We begin adding the features within this toolbar as early as the next chapter.
![]()
Figure 2-9: The Insert Tools toolbar
The following table summarizes the buttons available on the Insert Tools toolbar.
| Button | Label | Description |
|---|---|---|
| | Insert text object | Inserts a text object into the report. A text object is a type of report field that can contain text written by you, the report designer. Text objects allow you to add labels (or larger portions of text if desired) to your reports. You'll learn about text objects in Chapter 5. |
| | Insert group | Inserts a group into the report. A group is a set of database records that are related to each other in some common way. For example, all customers residing in Texas could be a group. Groups can help organize report data so that it is presented in a meaningful manner. You'll learn more about groups in Chapter 8. |
| | Insert summary | Inserts a summary object into the report. A summary object is a calculation performed on data within a group. You'll learn more about summary fields in Chapter 9. |
| | Insert cross-tab | Inserts a cross-tab object into the report. A cross-tab object is a format that presents data within rows and columns (similar to a spread-sheet). You'll find that inventory reports often work well in a cross-tab format. We look more at working with cross-tabs in the exercise at the end of Part II. |
| | Insert OLAP grid | Inserts an OLAP grid object into the report. OLAP is short for online analytical processing. Many databases utilize OLAP tools, which provide multidimensional analysis on data. For example, a database with OLAP tools might provide time series and trend analysis views. This button allows users to add an OLAP grid to the report. |
| | Insert subreport | Inserts a subreport into the report. A subreport is a self-contained report that displays within another report. Think of subreports as reports within a report. Often, subreports are existing reports that are imported into another report. You'll learn more about subreports in Chapter 13. |
| | Insert line | Inserts a line into the report. Lines are often added to reports in order to emphasize important data. |
| | Insert box | Inserts a box into the report. Boxes are often added to reports to enclose data or create some other graphical effect. |
| | Insert picture | Inserts a picture into the report. Pictures are graphic files (such as company logos) that you may import into your report. We look more at working with pictures in the exercise at the end of Part II. |
| | Insert chart | Inserts a chart into the report. Crystal Reports provides the ability to generate colorful charts from a report's data. You'll learn about adding charts to your reports in Chapter 12. |
| | Insert map | Inserts a map into the report. In Crystal Reports, maps are similar to charts in that they're information presented in a graphical format. The information is obtained from a report's data. You'll learn about adding maps to your reports in Chapter 12. |
Exploring the Expert Tools Toolbar
The last of Crystal Reports' toolbars is the Expert Tools toolbar (shown in Figure 2-10). The Expert Tools toolbar contains access to some of Crystal Reports' most advanced report-enhancing functionality. This advanced functionality is often made available through dialog boxes, better known as Experts.
![]()
Figure 2-10: The Expert Tools toolbar
Examples of some of Crystal's Experts include the Template Expert (explored in Chapter 4), the Database Expert (explored briefly in this chapter and in more detail in Chapter 6), the Select Expert (explored in Chapter 7), and the Group Expert (explored in Chapter 8).
The following table summarizes the buttons available on the Expert Tools toolbar.
| Button | Label | Description |
|---|---|---|
| | Database Expert | Allows users to access the Database Expert. The Database Expert lets users make additional database tables and fields available to a report. You'll learn more about the Database Expert in Chapter 6. |
| | Group Expert | Allows users to access the Group Expert. The Group Expert lets users define how a report groups and sorts data. You'll learn more about the Group Expert in Chapter 8. |
| | Group Sort Expert | Allows users to access the Group Sort Expert. The Group Sort Expert lets users sort Top n or Bottom n groups (with n representing the number you specify). This type of sorting is most commonly utilized in cross-tabs. You'll look more at working with the Group Sort Expert at the end of Part II. |
| | Record Sort Expert | Allows users to access the Record Sort Expert. The Record Sort Expert lets users define the sorting order of database records. You'll learn more about the Record Sort Expert in Chapter 8. |
| | Select Expert | Allows users to access the Select Expert. The Select Expert lets users define the records to display within a report, as well as filter the records that are not to display. You'll learn more about the Select Expert in Chapter 7. |
| | Section Expert | Allows users to access the Section Expert. The Section Expert lets users control various report section functionality (such as suppressing sections, inserting page breaks within a section, and adding multiple columns to a section). You'll learn more about the Section Expert in Chapter 3. |
| | Formula Workshop | Allows users to access the Formula Workshop. The Formula Workshop lets users create and modify formulas used within a report. You'll learn more about the Formula Work-shop in Chapter 10. |
| | OLAP Report Settings | Allows users to access the OLAP Report Settings. The OLAP Report Settings changes the report settings of an OLAP grid. This option is available only in OLAP reports. |
| | Template Expert | Allows users to access the Template Expert. The Template Expert lets users add a predesigned report appearance to a report. You'll learn more about the Template Expert in Chapter 4. |
| | Format | Allows users to access the Format Editor. The Format Editor lets users change the appearance of report fields and other report objects within a report. You'll learn more about the Format Editor in Chapter 5. |
| | Insert Hyperlink | Allows users to insert or define hyperlinks within a report. This button lets users access the Hyperlink tab of the Format Editor dialog box. The Hyperlink tab allows users to define and modify hyperlinks included within a report. |
| | Highlighting Expert | Allows users to access the Highlighting Expert. The Highlighting Expert lets users apply conditional formatting to report fields. Conditional formatting is essentially the following formula: If the value of field x meets condition A, then apply the specified formatting to the field selected. You'll look more at working with highlighting in the exercise at the end of Part II. |
|
EAN: 2147483647
Pages: 177