130.
| [Cover] [Contents] [Index] |
Page 214
5.3.2 Texture features derived from the GLCM
The principal ideas of texture measurement from GLCM are based on the following observations. If an image contains large homogeneous patches (i.e. it exhibits a coarse texture pattern), and the measurement distance d is relatively small in comparison with the texture structure, then neighbouring grey level pairs should have very similar values. Consequently, the joint neighbouring pair distribution within the GLCM shows higher values concentrated around its principal diagonal (i.e. in the NW/SE direction, cells (i, j), i=j). Conversely, for a ‘busy’ texture pattern (i.e. grey value varying considerably within a short range), if the measurement distance d is comparable to the scale of the texture structure, the grey level of points separated by d will be quite different. Therefore, high values in the GLCM are spread out away from the principal diagonal direction. In an extreme case, if all the pixel values are selected at random, the entries in the GLCM will show a uniform distribution. Once these relationships have been recognised, one can develop methods to quantify texture information contained in the GLCM.
To illustrate this idea, an example is shown in Figure 5.16 in which there are four grey levels. In Figure 5.16a, the texture patterns are formed by several homogeneous patches (i.e. the texture pattern is coarse), while in Figure 5.16b the texture patterns are finer and smoother. The corresponding GLCMs are shown in Figures 5.16c and d. It is clear that the GLCM in Figure 5.16c contains large values around the principal diagonal direction; however, the values in Figure 5.16d show a relatively even spread.
Haralick (1973) proposed a variety of texture measures based on the GLCM. These texture measures, called textural features, have been employed by a number of researchers (Franklin and Peddle, 1990; Sali and Wolfson, 1992), and the results have generally been successful. Four texture features, which are the most frequently used by researchers, are described here. Other indices are given by Haralick (1973). In what follows, p(i, j) denotes the (i, j)th entry in a normalised GLCM, and NG denotes number of grey levels in the quantised image.
(1) Angular Second Moment (ASM):
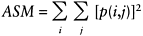 |
(5.40) |
The measure of ASM will output a higher value when co-occurrence frequency p(i, j) is concentrated in few places in the GLCM, e.g. the main diagonal direction. If the p(i, j) are close in value, then ASM will generate a small value. For instance, ASM for the pattern shown in Figure 5.16a (using matrix (e)) is 0.19, while for Figure 5.16b (using matrix (f)) is 0.06.
| [Cover] [Contents] [Index] |
EAN: 2147483647
Pages: 354
- Chapter I e-Search: A Conceptual Framework of Online Consumer Behavior
- Chapter II Information Search on the Internet: A Causal Model
- Chapter IV How Consumers Think About Interactive Aspects of Web Advertising
- Chapter X Converting Browsers to Buyers: Key Considerations in Designing Business-to-Consumer Web Sites
- Chapter XI User Satisfaction with Web Portals: An Empirical Study