Cost Overruns
|
The risk of underestimating costs associated with implementation is always high. Risk tends to decline with experience. Companies that have established a core competency in executing specific SAs experience greater success in managing expenses of initiatives. Higher than expected integration costs would lead to lower cash flows. Cost overruns may also appear because of poor anticipation of all the expenses required to implement an SA.
Cost of Capital—Adjustment for Risk
Another major component required to estimate the intrinsic value is the cost of capital. As mentioned, the cost of capital is used as a benchmark in adjustment for risk. The cost of capital is generally considered an opportunity cost because it represents the return forgone by investing in the Strategic Alternative rather than in other investments that yield a return.[1] In the world of finance, the term capital is often used in several ways. For example, capital assets, sometimes called fixed assets, refer to the land, buildings, machinery, and equipment used in the operation of the business. However, in computing the cost of capital we will consider two types of capital: debt and equity. To calculate the total cost of capital, it is necessary to compute the combined cost of debt and equity capital. This is commonly referred to as the weighted average cost of capital, or WACC. Let's walk through how to calculate the cost of debt, the cost of equity, and ultimately the weighted average cost of capital.
Cost of Debt
Debt capital is the investment in a company by creditors for the purpose of earning interest. Total debt is simply the total of all interest-bearing debt, or total liabilities less the liabilities on which interest is not paid. Liabilities, such as accounts payable and accrued liabilities, do not earn interest and are not considered in the calculation. The two inputs we will use to arrive at the total amount of debt capital and the effective (after-tax) interest rate. Calculation of the effective interest rate will be shown below.
There are several ways to obtain the interest rate on debt capital. One of the simplest ways is to find the interest rate stated in the footnotes to the financial statements of a company. An alternative is to review The Value Line Investment Survey or similar research reports. Value Line reports the financial strength of a company in a box at the lower right corner of the company's report. Financial strength is given an alphabetic ranking from A + +, the strongest ranking, to C, which is the weakest. The interest rates at which a company can borrow vary according to financial strength. Another method is to check with the rating agencies that make these assessments. The corresponding interest rates for these ratings are found in The Wall Street Journal.
To calculate the effective interest rate we must first have the income tax rate. This also may be found in the Value Line Reports . The effective interest rate is calculated as follows:
![]()
Assume a company has an A + + rating. Its interest rate would then be 6.0 percent. With an income tax rate of 32 percent, the effective interest rate would be calculated as follows:
![]()
This rate represents the cost of the company's cost of debt capital and can now be combined with the company's cost of equity capital to arrive at the total cost of capital.
Cost of Equity Capital
Many managers and accountants challenge the concept of the cost of capital because it involves some subjectivity in the selection of inputs. However, investors expect to be compensated for taking risk. Traditional accounting does not deal with this issue. The cost of equity is derived from the capital asset pricing model (CAPM), which can be calculated using the following formula:
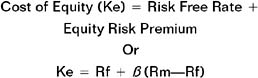
The values in the formula are represented as follows:
-
Rf is the risk-free rate for U.S. treasury bonds. The rate for U.S. treasury long bonds can be found daily in The Wall Street Journal, USA Today, or many other leading newspapers throughout the world.
-
Rm is the expected rate of return provided by the stock market as a whole. The figure is usually the rate of return for a broad market basket of stocks, such as those listed on the Standard and Poor 500.
-
β is the beta coefficient, or risk factor. The risk factor is a multiplier that reflects the risk of the Strategic Alternative that is being analyzed versus the broader risk of alternative investments.
Beta
Most investors want to be compensated for taking on more risk. The beta coefficient was conceived to deal with this issue. It measures the risk associated with the common stock of a given company relative to the stock market as a whole. Beta measures the relative volatility of a company's stock to the price movements in the market. Therefore, a stock's beta measures its contribution to the overall riskiness of a portfolio or a group of stocks. So theoretically, beta is a correct measure of riskiness.
![]()
If stocks with greater-than-average betas (β > 1) are added to a portfolio, the riskiness of the portfolio increases. Conversely, if stocks with below-average betas (β < 1) are added, the portfolio's overall risk level will decrease. Therefore, a beta of one means that the common stock of the company in question moves exactly with the market as a whole. If the company, or strategic project, is an "average" risk, use a beta factor of one.
The beta of a listed corporation can also be found in a company's Value Line report. If beta is not listed, risk becomes a matter of judgment.
Assume a company has a beta of 1.2. The thirty-year Treasury Bond (Rf) carries interest at 5 percent and the market return (Rm) is 10 percent.
Ke = Rf + β(Rm—Rf)
5% + 1.2 (10%—5%) = 11.0%
Weighted Average Cost of Capital
Now that we have calculated the cost of debt and the cost of equity, we find a single rate that reflects the cost of capital. We can do this by computing the weighted cost of capital. The weighted average is computed by first determining the percentage of total capital that is comprised of debt and the percentage that is comprised of equity. The percentages are available in Value Line reports, in the section noted as "Capital Structure".
The percent of debt is multiplied by the effective (after-tax) interest rate. The percent of equity is multiplied by the rate representing the cost of equity. They are then added together to find the rate representing the cost of capital.
Assume that our company has debt capital representing 40 percent of invested capital, with the remaining representing equity capital. The cost of capital rate is:
Debt Capital = 40% 4.1% = 1.6%
Equity Capital = 60% 11.00% = +6.6 %
Weighted Average Cost of Capital = 8.2%
[1]Richard A. Brealy and Stewart C. Myers, Principles of Corporate Finance, 6th ed. (New York: McGraw Hill, 2000).
|
EAN: 2147483647
Pages: 117