| Okay, you have had enough reading for now. To get an idea of how LabVIEW works, you can open and run a few existing LabVIEW programs. NI Example Finder LabVIEW ships with many working examples that will help you learn common programming techniques and see applications that accomplish common hardware input/output and data processing tasks. The NI Example Finder is a very useful tool that assists in the search for these examples. You can open the NI Example Finder, shown in Figure 1.7, by launching LabVIEW and then going to the Help menu and selecting Find Examples . . . . Figure 1.7. The NI Example Finder 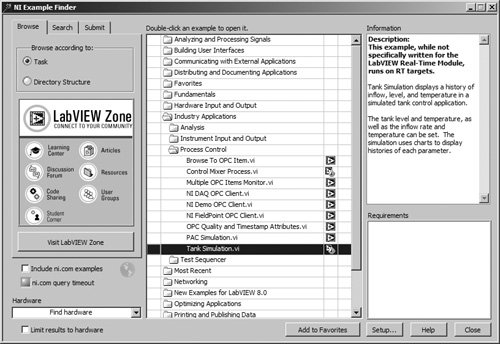
If you are just getting started with LabVIEW, you will want to set the Browse according to: option to Task and start exploring inside the Industry Applications folder. This folder contains demonstration and simulation applications, which are an excellent place to begin learning about LabVIEW. If you are looking for an example on a topic that you don't see listed in the folder tree view, you can switch to the Search tab of the Example Finder and perform a keyword search. 
The previous steps are the process for quickly loading example VIs that come with LabVIEW. You can also access all the LabVIEW example VIs directly in the examples directory inside your LabVIEW installation directory. For example, on Windows, LabVIEW is usually installed at C:\Program Files\National Instruments\LabVIEW. So the examples directory is at C:\Program Files\National Instruments\LabVIEW\examples. The Temperature System Demo example in particular would be located at C:\Program Files\National Instruments\LabVIEW\examples\apps\tempsys.llb\Temperature System Demo.vi. Generally, however, it's easier to find examples by using the NI Example Finder feature as just described.
Examples on the CD Whether you are using the Professional, Full, or Evaluation version of LabVIEW, just launch it. Make sure you can access the EVERYONE directory from the CD or your hard drive, as described in the Preface; it contains the activities for this book. After launching LabVIEW, a dialog box will appear. To open an example, select Open VI and choose the one you want.
Throughout this book, use the left mouse button (if you have more than one) unless we specifically tell you to use the right one (often we will tell you to "right-click" on something). On Mac OS X computers that have a one-button mouse, <control>-click when right-mouse functionality is necessary.
Activity 1-1: Temperature System Demo Open and run the VI called Temperature System Demo.vi by following these steps: 1. | Launch the NI Example Finder, as described in the NI Example Finder section of this chapter.
| 2. | With the Browse tab selected and the Browse according to: option set to Task, navigate the folder tree to "Industry Applications," then "Analysis." Double-click "Temperature System Demo.vi" to open it. This VI may also be found using the File>>Open menu option and browsing to the following location, beneath the LabVIEW installation folder:
examples/apps/tempsys.llb/Temperature System Demo.vi
| | | 3. | You will see the VI shown in Figure 1.8.
Figure 1.8. Temperature System Demo.vi front panel 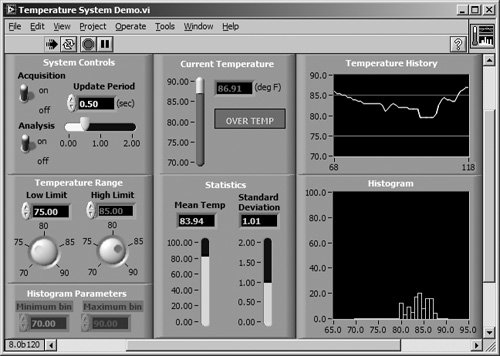
| | | 4. | Run the VI by clicking on the Run button, located on the VI's Toolbar (the Toolbar is the row of icons beneath the VI's menubar). The Run button will change appearance to indicate that the VI is running. Other buttons on the Toolbar may also change appearance (or disappear) because certain buttons are only applicable while the VI is running (such as the Abort button), and others are only applicable while the VI is not running (such as those used for editing).

Run Button Inactive

Run Button Active

Abort Button
Notice also that the Abort button becomes active in the Toolbar. You can press it to abort program execution.
Temperature System Demo.vi simulates a temperature monitoring application. The VI makes temperature measurements and displays them in the thermometer indicator and on the chart. Although the readings are simulated in this example, you can easily modify the program to measure real values. The Update Period slide controls how fast the VI acquires the new temperature readings. LabVIEW also plots high and low temperature limits on the chart; you can change these limits using the Temperature Range knobs. If the current temperature reading is out of the set range, LEDs light up next to the thermometer.
This VI continues to run until you click the Acquisition switch to off. You can also turn the data analysis on and off. The Statistics section shows you a running calculation of the mean and standard deviation, and the Histogram plots the frequency with which each temperature value occurs.
|
Tweaking Values 5. | Use the cursor, which takes on the personality of the Operating tool while the VI is running, to change the values of the high and low limits. Highlight the old high or low value, either by clicking twice on the value you want to change, or by clicking and dragging across the value with the Operating tool. Then type in the new value and click on the enter button, located next to the run button on the Toolbar. Also, try changing the high and low limits using the round knob controls. Note how changing the values with the knobs takes effect instantly.

Operating Tool
| 6. | Change the Update Period slide control by placing the Operating tool on the slider, and then clicking and dragging it to a new location.

Enter Button
You can also operate slide controls using the Operating tool by clicking on a point on the slide to snap the slider to that location, by clicking on a scroll button to move the slider slowly toward the arrow, or by clicking in the slide's digital display and entering a number.
Even though the display changes, LabVIEW does not accept the new values in digital displays until you press the enter button, or click the mouse in an open area of the window. This is different from the behavior of the knob, which updates the value immediately. | 7. | Try adjusting the other controls in a similar manner.
| 8. | Stop the VI by clicking on the Acquisition switch.
|
Examine the Block Diagram The block diagram shown in Figure 1.9 represents a complete LabVIEW application. You don't need to understand all of these block diagram elements right nowwe'll deal with them later. Just get a feel for the nature of a block diagram. If you already do understand this diagram, you'll probably fly through the first part of this book! Figure 1.9. Temperature System Demo.vi block diagram 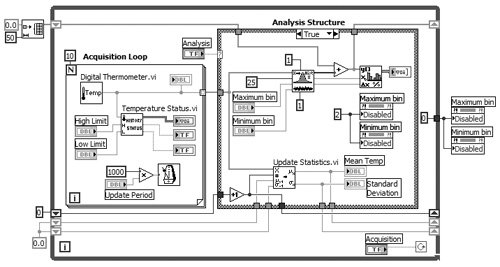
9. | Open the block diagram of Temperature System Demo.vi by choosing Show Diagram from the Windows menuor you can use the <ctrl>-E shortcut on Windows, <command>-E on Mac OS X, or <meta>-E on Linux.
| 10. | Examine the different objects in the diagram window. Don't panic at the detail shown here! These structures are explained step by step later in this book.
| 11. | Open the contextual Help window by choosing Show Context Help from the Help menuor you can use the <ctrl>-H shortcut on Windows, <command>-H on Mac OS X, or <meta>-H on Linux. Position the cursor over different objects in the block diagram and watch the Help window change to show descriptions of the objects. If the object is a function or subVI, the Help window will describe the inputs and outputs as well.

Highlight Execution Button
| 12. | Turn on execution highlighting by clicking on the Highlight Execution button, so that the light bulb changes to the active (lighted) state. With execution highlighting turned on, you can watch the data flow through the wires. You will see small data bubbles that travel along the wires, representing the data flowing through the wires. We will learn more about this and other useful debugging tools in Chapter 5.

Highlight Execution Button (Active)
|
Hierarchy 
LabVIEW's power lies in the hierarchical nature of its VIs. After you create a VI, you can use it as a subVI in the block diagram of a higher-level VI, and you can have as many layers of hierarchy as you need. To demonstrate this versatile ability, look at a subVI of Temperature System Demo.vi. 13. | Open the Temperature Status subVI by double-clicking on its icon.

Temperature Status subVI
The front panel shown in Figure 1.10 springs to life.
Figure 1.10. The front panel of the Temperature Status subVI 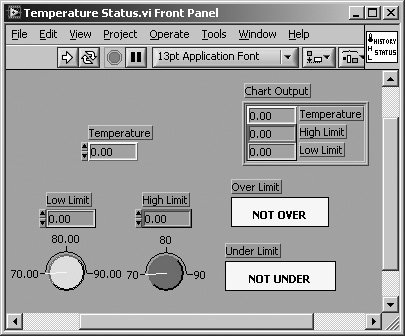
|
Icon and Connector
The icon and connector provide the graphical representation and parameter definitions needed if you want to use a VI as a sub-routine or function in the block diagrams of other VIs. They reside in the upper-right corner of the VI's front panel window. The icon graphically represents the VI in the block diagram of other VIs, while the connector terminals are where you must wire the inputs and outputs. These terminals are analogous to parameters of a subroutine or function. You need one terminal for each front panel control and indicator through which you want to pass data to the VI. The icon sits on top of the connector pattern until you choose to view the connector. Figure 1.11. Temperature Status.vi Icon and Connector Pane 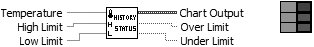
By using subVIs, you can make your block diagrams modular and more manageable. This modularity makes VIs easy to maintain, understand, and debug. In addition, you can often create one sub-VI to accomplish a function required by many different VIs. Now run the top-level VI with both its window and the Temperature Status subVI window visible. Notice how the subVI values change as the main program calls it over and over. 14. | Select Close from the File menu of the Temperature Status subVI. Do not save any changes.
| 15. | Select Close from the File menu of Temperature System Demo.vi, and do not save any changes.
|
Selecting Close from the File menu of a VI diagram closes the block diagram window only. Selecting Close on a front panel window closes both the panel and the diagram.
Activity 1-2: Frequency Response Example This example measures the frequency response of an unknown "black box." A function generator supplies a sinusoidal input to the black box (hint: it contains a bandpass filter, which lets only certain signal components through it). A digital multi-meter measures the output voltage of the black box. Although this VI uses subVIs to simulate a function generator and a digital multimeter, real instruments could easily be hooked up to a real black box to provide real-world data. You would then use sub-VIs to control data acquisition, GPIB transfers, or serial port communication to bring in or send out real data instead of simulating it. You will open, run, and observe the VI in this activity. 1. | Launch the NI Example Finder, as described in the NI Example Finder section of this chapter.
| | | 2. | With the Browse tab selected and the Browse according to: option set to Task, navigate the folder tree to "Industry Applications," and then "Instrument Input and Output." Double-click "Frequency Response.vi" to open it. (Note: You can also find this example in the LabVIEW install directory, under examples/apps/freqresp.llb.)
| 3. | You will see the VI shown in Figure 1.12.
Figure 1.12. Frequency Response.vi front panel 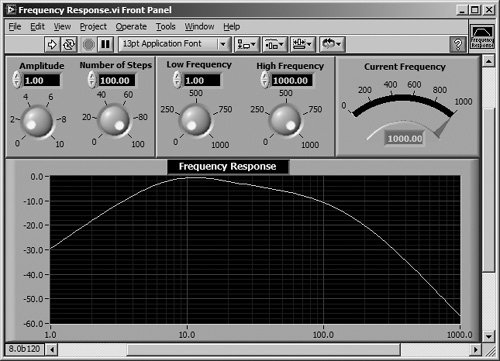
| 4. | Run the VI by clicking on the run button. You can specify the amplitude of the input sine wave and the number of steps the VI uses to find the frequency response by changing the Amplitude control and the Number of Steps control, and then running the VI again. You can also specify the frequency sweep by inputting the upper and lower limits with the Low Frequency and High Frequency knobs. Play with these controls and observe the effect they have on the output of the "black box."
Run Button
| 5. | Open and examine the block diagram by choosing Show Diagram from the Window menu.
| | | 6. | Close the VI by selecting Close from the File menu. These exercises should give you a basic feel for LabVIEW's "G" programming environment. With the G language, you'll find writing powerful applications (and debugging them) to be a snap! Read on to learn how.
|
|