| You will build a VI that measures temperature approximately every 0.25 seconds for 10 seconds. During the acquisition, the VI displays the measurements in real time on a waveform chart. After the acquisition is complete, the VI plots the data on a graph and calculates the minimum, maximum, and average temperatures. | | 1. | Open a new front panel and build the VI shown in Figure 8.46.
Figure 8.46. Front panel of the VI you will create during this activity 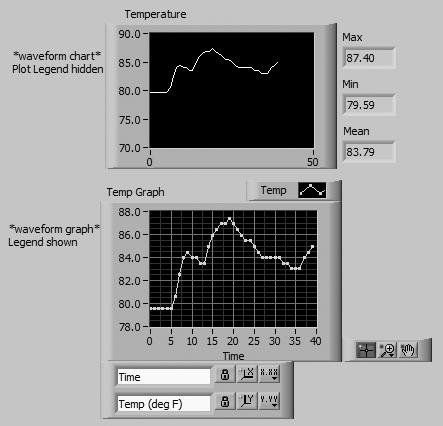
| 2. | Rescale the chart so that it ranges from 70.0 to 90.0. Also, make sure autoscaling is on for both axes of the graph (it should be, because that is the default).
| 3. | In the plot legend, using the Labeling tool, type in Temp as shown. Now pop up (or click with the Operating tool) on the Temp plot representation in the legend and change the Point Style to small squares. Feel free to color your plots as well.
The Temperature chart displays the temperature as it is acquired. After acquisition is finished, the VI plots the data in Temp Graph. The Mean, Max, and Min digital indicators will display the average, maximum, and minimum temperatures, respectively.
| | | 4. | Build the block diagram shown in Figure 8.47. Make sure to use the Help window to show you the inputs and outputs of these functions, and pay attention to the wire whiskers and tip strips, or you will almost certainly wire to the wrong terminal!
Figure 8.47. Block diagram of the VI you will create during this activity 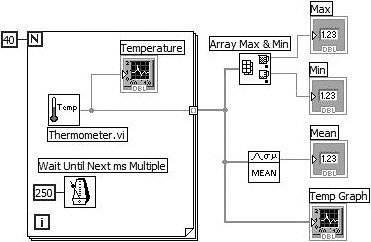
|

Thermometer.vi Thermometer.vi. Use the Select A VI . . . palette to access the one you built. It should probably be in your MYWORK directory. If you don't have it, you can use Thermometer.vi in the EVERYONE\CH05 directory or Digital Thermometer.vi, located in the <LabVIEW>\Activity folder. Thermometer returns one temperature measurement each time it is called. 
Wait Until Next ms Multiple Function Wait Until Next ms Multiple function (Programming>>Timing palette) causes the For Loop to execute every 0.25 seconds (250 ms). 
Array Max & Min Function Array Max & Min function (Programming>>Array palette) returns the maximum and minimum values in the array; in this case, the maximum and minimum temperatures measured during the acquisition. 
Mean.vi Mean.vi (Mathematics>>Probability and Statistics palette) returns the average of the temperature measurements. Make sure you wire to the right output terminal to get the mean. 5. | The For Loop executes 40 times. The Wait Until Next ms Multiple function causes each iteration to take place approximately every 250 ms. The VI stores the temperature measurements in an array created at the For Loop border using auto-indexing. After the For Loop completes, the array passes to various nodes. The Array Max & Min function returns the maximum and minimum temperature. Mean.vi returns the average of the temperature measurements.
| 6. | Return to the front panel and run the VI.
| 7. | Using the scale legend (show it by choosing Visible Items>>Scale Legend from the pop-up menu on the graph), change the precision so that the graph shows three decimal places on the Y scale.
| 8. | Using the Graph Palette, click on the Zoom button, select a zooming mode, and zoom in on the graph.

Zoom Button
| | | 9. | Pop up on the graph and select Visible Items>>Cursor Legend. The cursor legend will first appear empty (with no cursors). Pop up on the cursor legend and select Create Cursor>>Free to create a free cursor (one that does not snap to plot points), as shown in Figure 8.48.
Figure 8.48. Creating a free cursor from the pop-up menu of the cursor legend 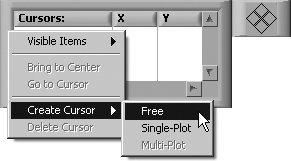
Use the Operating tool to drag the cursor around on the graph; pay attention to how the X and Y values in the cursor display change. These values can help you determine the value of a particular point on the graph. Now use the Cursor Movement Control buttons to move the cursor around. Create a second cursor and make it active. Use the Cursor Movement Control to move both cursors at the same time. Change the color of one of your cursors by popping up on the cursor label in the cursor legend and selecting a color from the Attributes>>Color submenu.
Are you starting to see what cursors can do? If you want, select the Cursor 0 text and replace it with a cursor name of your own. Next, let's create a cursor that snaps to the data points of a plot by selecting Create Cursor>>Single-Plot. Notice that this cursor can be dragged around on the graph with the mouse, but it snaps to points on a plotit cannot be moved to arbitrary locations. You can tell which plot a cursor is snapped to, by looking in the cursor legend at the plot name beneath the cursor label. You can configure a cursor to snap to All Plots or only one specific plot by popping up on the cursor label and selecting All Plots or the desired plot name from the Snap To>> submenu. When you use the Cursor Movement Control on a cursor, you'll find that the cursor will track the plot it's assigned to.
| 10. | Close and save the VI. Name it Temperature Analysis.vi and place it in your MYWORK directory or VI library.
|
|