Monitoring System Resources
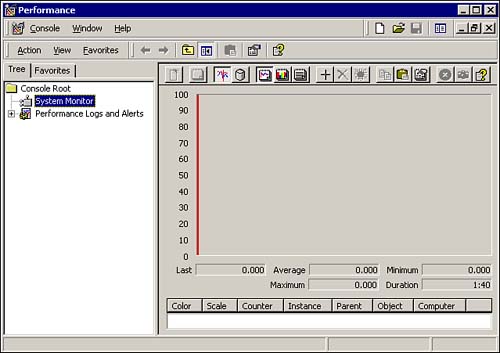
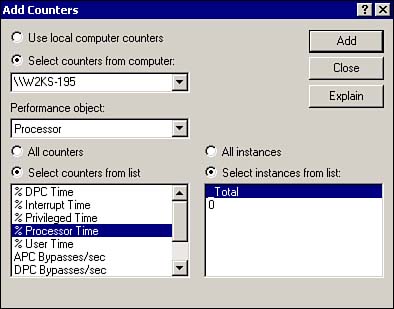
| Although Task Manager can give you a quick overview of system performance, there will be situations in which a more thorough investigation is needed. This is where the Performance tool comes in handy. The Performance tool is actually made up of two separate Microsoft Management Console (MMC) snap-ins: System Monitor and Performance Logs and Alerts . The Performance tool is started from the Windows 2000 Start menu. Select Start, Programs, Administrative Tools, Performance. As shown in Figure 5.5, the Performance tool opens with the System Monitor view displayed. Figure 5.5. The Windows 2000 Performance tool showing the System Monitor view. System MonitorThe System Monitor snap-in allows you to view real-time performance data contained in the counters from your domain controllers, member servers, or workstations on your network. In addition, System Monitor allows you to review performance data that is stored in a log file created with the Performance Logs and Alerts snap-in. Windows 2000 is a modular, object-oriented operating system. Each subsystem within Windows 2000 is an object. For example, the CPU is an object, the memory is an object, the storage subsystem is an object, and so on. As your computer performs various tasks , each of these objects generate performance data. Each object has several monitoring functions called counters . Each counter offers insight into a different aspect or function of the object. For example, the memory object has counters that measure % Committed Bytes In Use, Available Bytes, Page Faults/sec, and more. System Monitor takes the readings from these counters and presents the information to you in a human-readable format ( numbers or graphs). In addition, objects can be separated by instance . Instance is the terminology used to refer to multiple occurrences of the same type of object, such as in a multiprocessor server. A separate instance exists for each processor. By default, System Monitor is started without any counters displayed. To add the counters to be monitored , click the "+" button on the System Monitor menu bar. This opens the Add Counters dialog box shown in Figure 5.6. Figure 5.6. The Windows 2000 System Monitor showing the Add Counters dialog box. In the Add Counters dialog box, you can make choices from several areas to customize your monitoring needs. The choices found on this dialog box are as follows :
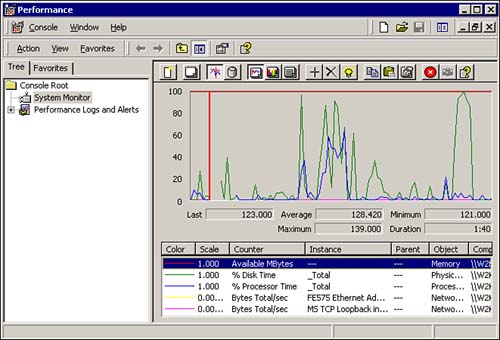
After selecting each counter, click the Add button to add the counter to the System Monitor display. For a description of each counter, highlight the counter and click the Explain button. When finished, click the Close button. The number of objects that are available for monitoring will vary by system. Most server services and applications, such as DNS, DHCP, and mail servers, will install their own counters that can be used to monitor the performance of those functions. Each counter can be displayed as a colored line in one of the graph views. Multiple counters from the same system or from remote systems can be viewed simultaneously . Figure 5.7 shows you an example of what one of the graph views, of which there are several, may look like on your system. Figure 5.7. The Windows 2000 System Monitor showing server usage counters. Of all the items you can monitor on a typical server, the objects that you need to monitor closely for performance issues are
These counters provide instant insight into the overall performance on a system. When these counters get too high, it's a good indication of a need to upgrade the system or segment the network. The Performance Logs and Alerts Snap-InAlthough System Monitor provides far more system monitoring information than Task Manager, it still only provides a snapshot view of system performance. To perform a more thorough evaluation of system performance, you need to view the system statistics over a period of time. You can find these statistics in the Performance Logs and Alerts tool located underneath System Monitor in the Performance Tool MMC. The following two sections detail the logging and alert features you can use to capture performance data over an extended time period. Performance LogsThe Performance Logs and Alerts MMC snap-in allows you to log performance data over a period of time and save it to a log file for later viewing. There are two logging options available: Counter Logs and Trace Logs . Counter Logs allow you to record data about hardware usage and the activity of system services from local or remote computers. You can configure logging to occur manually or automatically based on a defined schedule. Trace logs record data when certain activity, such as disk I/O or a page fault, occurs. When the event occurs, the provider sends the data to the log service.
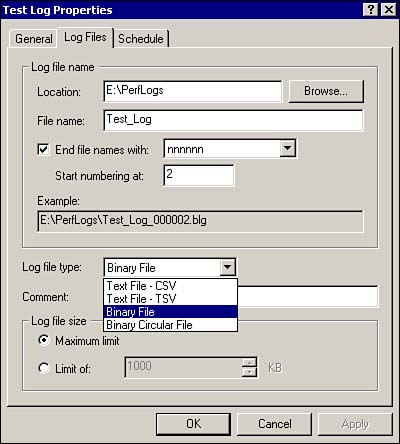
The snap-in allows you to save log data in the following file formats:
By making the data available in so many common formats, you have the option of analyzing the data using the default Microsoft tools or importing it into the tool of your choice.
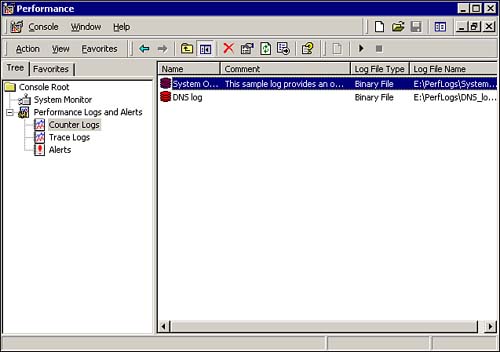
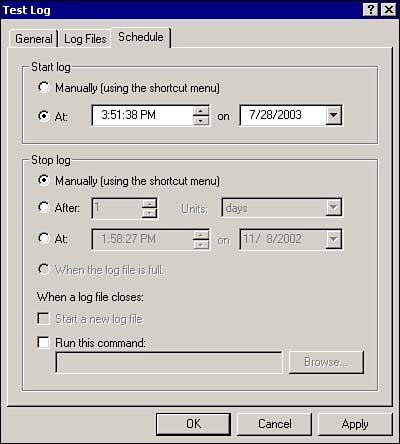
The Performance utility allows you to log both on an object basis and a counter basis (see Figure 5.8). This means that you can configure a log to record all the data for an object instead of using individual counters. Therefore, after a log file is recorded, you can select any counter from an object to examine. After you determine what to record, you need to determine two time- related issues: the measurement interval and the length of time to record the log file . These issues are detailed as follows:
Figure 5.8. The Windows 2000 Performance Logs and Alerts showing Counter logs. The sample log is defined with the following basic counters:
To create a new counter log
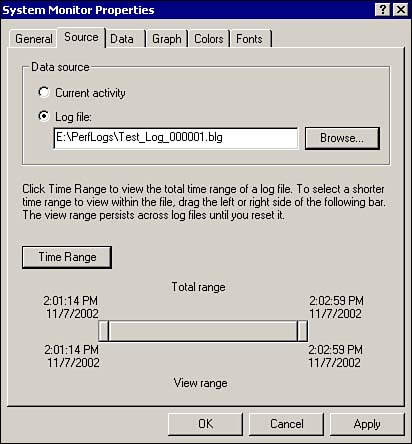
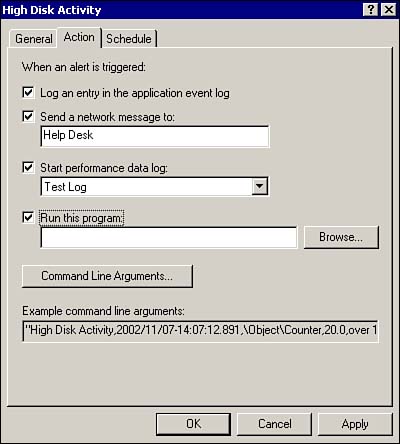
If you selected to manually start the counter log, you can start it by right-clicking the log entry in the right pane of the Performance Logs and Alerts snap-in and selecting Start. The icon for the log will be green when running, red when stopped . After you have recorded data in your log file, you can view it within System Monitor. To open your log file, select the System Monitor entry in the left pane of the MMC. Next, right-click anywhere in the right pane and select Properties. In the System Monitor Properties dialog box, select the Source tab. On the Source tab (see Figure 5.11), click the Browse button to browse for the log file. Figure 5.11. The System Monitor Properties dialog box showing the Source tab. You can click the Time Range button to adjust the times that you want to view within the log file. Click OK when finished. Performance AlertsThe Alerts container is used to define threshold alerts. These can be used with real-time measurements or with historical log files. An alert is issued when a specific counter crosses a defined threshold value. When this occurs, a trigger event is initiated. Creating an Alert is similar to configuring a Counter Log. Right-click the Alerts entry in the left pane of the Performance Logs and Alerts snap-in and select New Alert Settings. In the New Alert Settings dialog box, enter a name for the alert. In the properties dialog box, you can select the desired counters and the value threshold. If you click the Action tab, shown in Figure 5.12, you can select the action to take when the threshold is reached. Figure 5.12. Alert properties showing the Action tab. The options available are
Alerts are most often used to monitor systems in real-time. You can set an alert to notify you when a specific event occurs. Some of the conditions that you might want to configure an alert for are low disk space, swap file usage, and task queues for network cards and CPUs. Any of these items can point to a current or potential system problem. |
EAN: 2147483647
Pages: 155
- Article 326 Integrated Gas Spacer Cable Type IGS
- Article 366 Auxiliary Gutters
- Article 400: Flexible Cords and Cables
- Article 440: Air Conditioning and Refrigerating Equipment
- Example No. D2(b) Optional Calculation for One-Family Dwelling, Air Conditioning Larger than Heating [See 220.82(A) and 220.82(C)]