Section 3.3. Working with MapPoint Demographic Data
3.3. Working with MapPoint Demographic DataMapPoint 2004 ships with a lot of demographic data (also known as statistical data) that includes 136 categories for the United States and Canada and 43 categories for other countries worldwide. This demographic data includes statistics, such as population by location, average age by location, average household income by location, and so on. It is very useful when integrated with your own business data. For example, you may want to see total sales by state in the United Sates and then compare them with total population by state; this gives you an idea of your sales relative to population in each state. 3.3.1. Accessing the Demographic Data Categories ProgrammaticallyOur first task is to see which kind of demographic data is available on a per country basis programmatically. An active Map object exposes a DataSets collection. You can access the demographic data by calling the GeTDemographics method on the DataSets collection: //Get the demographics dataset by calling the //GetDemographics method MapPoint.DataSet dataset = map.DataSets.GetDemographics(MapPoint.GeoCountry.geoCountryUnitedStates); The GeTDemographics method takes the country as an input argument and returns a DataSet object containing demographic data for the specified country.
To get all demographic data categories supported by this DataSet, loop through its field collection: //Get dataset details if(dataset != null) { //Get all field names for(int i=1;i<=dataset.Fields.Count;i++) { object index = i; //Add the field name in a listbox listBox1.Items.Add(dataset.Fields.get_Item(ref index).Name); } }This code generates a listbox, shown in Figure 3-10, filled with all demographic categories that are available in MapPoint 2004 North American edition. Figure 3-10. MapPoint 2004 demographic categories in a ListBox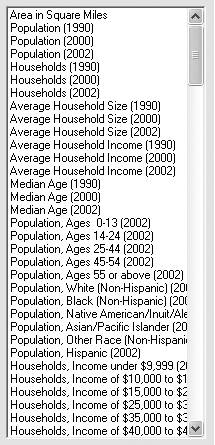 In case you are wondering how to interpret the list displayed in Figure 3-10, don't worryit's really simple: think of a table with rows and columns where the items from the list are the columns in that table. Now add one more column with some form of location information to the left of the existing columns in the table, and that's how the demographic data is organized. So an example demographic table can be interpreted somewhat like Table 3-6.
In the previous example, I have taken State as my location dimension; MapPoint 2004 demographic data supports the following location dimensions:
So, for any given demographic data item (such as "Population (2002)"), you can display a data map on any one of the above six location dimensions. In other words, if it were to be a command (going back to our hypothetical commands again), an example could be: "Show a Shaded Area Map for Population (2002) per State," and this command displays 2002 population statistics based on state by using the shaded area data map styles. Even though the demographic data categories are exposed, the actual data itself is not exposed for direct use. MapPoint 2004 APIs allow you to display demographic data based on location. Each of the previous categories contains statistical data, but the data makes more sense if you can either analyze or visualize it based on location. 3.3.2. Displaying Data Map Using Demographic DataOur next task is to display a data map using a demographic category based on location. We need three pieces of information to display a data map:
It makes sense to start with a simple scenario: displaying "Population (2002)" per state in a sized circle map. In this scenario, the map style used is GeoDataMapType.geoDataMapTypeSizedCircle, the data field argument value is "Population (2002)," and the show data by argument is GeoShowDataBy.geoShowByRegion1. For now, let's leave the data range specifications at their default values. 3.3.2.1. Displaying a data mapLet's write code to display a data map for these specifications. Assuming that you already have an instance of the MapPoint 2004 ActiveX Control in your Windows form, we will first get the demographic dataset: //Get a reference to the active map MapPoint.Map map = axMappointControl1.ActiveMap; //Get the MapPoint demographics dataset MapPoint.DataSet dataset = map.DataSets.GetDemographics(MapPoint.GeoCountry.geoCountryUnitedStates); Now that we have the MapPoint 2004 demographic dataset, define the data field argument: //Define the data field name as a key object datafieldKey = "Population (2002)"; //Now get the data field from the demographic dataset object[] datafields = new object[1]; datafields[0] = dataset.Fields.get_Item(ref datafieldKey); You might have noticed that I'm defining the datafields instance as an array of objects. You could also define it as a single object instance as long as you don't need to pass more than one field name. Next, define a few other arguments, such as color scheme and data range count: //Define the color scheme //Between 0 and 16; 3 represents orange/red shade int colorScheme = 3; //Define data range count //Between 1 and 8; 3 works for most int rangeCount = 3; //Define missing object optional values object missing = System.Reflection.Missing.Value; Now we have everything we need to display a data map, and the following code snippet shows the actual DisplayDataMap method call: //Now call the display data map for sized circle map MapPoint.DataMap datamap = dataset.DisplayDataMap(MapPoint.GeoDataMapType.geoDataMapTypeSizedCircle, datafields, MapPoint.GeoShowDataBy.geoShowByRegion1, MapPoint.GeoCombineDataBy.geoCombineByNone, MapPoint.GeoDataRangeType.geoRangeTypeDefault, MapPoint.GeoDataRangeOrder.geoRangeOrderDefault, colorScheme, rangeCount, missing, missing, missing, missing, missing); We are using the default values for range type and range order arguments. Finally, make sure that you have the legend pane open so that you know how to interpret the data map; the following code shows how to set the legend pane state: //Now make sure to display legend pane axMappointControl1.PaneState = MapPoint.GeoPaneState.geoPaneLegend; When you execute this code, a data map for population statistics per state, shown in Figure 3-11, is created. Figure 3-11. Sized circle map for population per state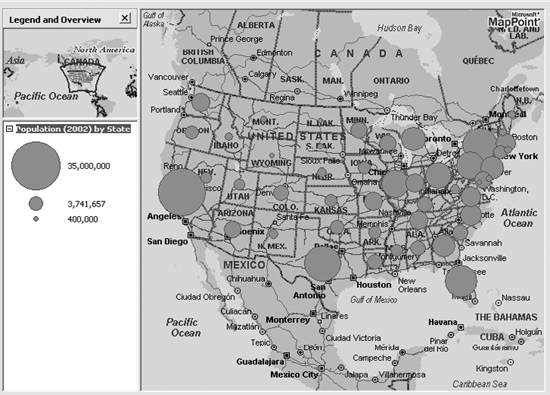 Remember that we have chosen to use the default data range type for this data map. A little investigation of the resulting datamap object properties (datamap.DataRanges.DataRangeType) reveals that MapPoint has chosen geoRangeTypeContinuousLog range type, so the resulting data map has three ranges with a low value of 400,000 and a high value of 35,000,000. While this data map does a good job of revealing which state has the largest population (California, with close to 35 million people!) it does not do a very good job indicating the state with smallest population (Wyoming, a quiet 500,000). 3.3.2.2. Defining data range type and countIt might be useful to expand the data range a little by increasing the data range count to, say, eight (the maximum allowed value). However, changing the data range count to eight also requires a change in the range type (since the default data range does not support range count other than three); to meet this requirement, change the data range type to geoRangeTypeDiscreteEqualRanges. The following code reflects the two changes discussed: //Define data range count //Between 1 and 8; changing from 3 to 8 int rangeCount = 8; The new method call looks as follows: //Now call the display data map for sized circle map MapPoint.DataMap datamap = dataset.DisplayDataMap(MapPoint.GeoDataMapType.geoDataMapTypeSizedCircle, datafields, MapPoint.GeoShowDataBy.geoShowByRegion1, MapPoint.GeoCombineDataBy.geoCombineByNone, MapPoint.GeoDataRangeType.geoRangeTypeDiscreteEqualRanges, MapPoint.GeoDataRangeOrder.geoRangeOrderDefault, colorScheme, rangeCount, missing, missing, missing, missing, missing); When you execute the code with these new settings, the data map displayed looks like Figure 3-12. Figure 3-12. Sized circle population using larger data range Even though the data map has an expanded data range, it's still unclear from the map which state has the smallest population, so you need to use the custom data ranges by specifying custom ranges . 3.3.2.3. Specifying custom data rangesIn this case, we clearly need a range that starts much lower than the starting range shown in Figure 3-4 (0 to 4,379,999 would be appropriate here). So, define a custom data range as shown below: //Define custom range values //Since the range count is 8, //we are defining 9 range objects object[] arrayOfCustomValues = new object[9]; //Stretch the lower end by defining ranges //pretty close to each other arrayOfCustomValues[0] = 250000; arrayOfCustomValues[1] = 500000; arrayOfCustomValues[2] = 750000; arrayOfCustomValues[3] = 1000000; //Set the maximum value arrayOfCustomValues[8] = 35000000; In this code, I have just defined the starting range as 250,000 and set the next three ranges in 250,000 increments. What I'm really trying to do here is to stretch the lower end of the data range to have smaller ranges to accommodate better size variation in the circles. I also set the maximum limit for the data to be 35,000,000. The DisplayDataMethod call with this custom data range specification is shown here: //Now call the display data map for sized circle map MapPoint.DataMap datamap = dataset.DisplayDataMap(MapPoint.GeoDataMapType.geoDataMapTypeSizedCircle, datafields, MapPoint.GeoShowDataBy.geoShowByRegion1, MapPoint.GeoCombineDataBy.geoCombineByNone, MapPoint.GeoDataRangeType.geoRangeTypeDiscreteEqualRanges, MapPoint.GeoDataRangeOrder.geoRangeOrderDefault, colorScheme, rangeCount, arrayOfCustomValues, missing, missing, missing, missing); The resulting data map is shown in Figure 3-13. Now, as you can see, the circle in the state of Wyoming looks smallest of all the circles, so it has the smallest population in all states (only 499,904). Using custom data range specification, we could display both the most and least populous states. While we are at it, we can also customize the legend pane to reflect what we are trying to achieve. Figure 3-13. Sized circle population chart with custom data range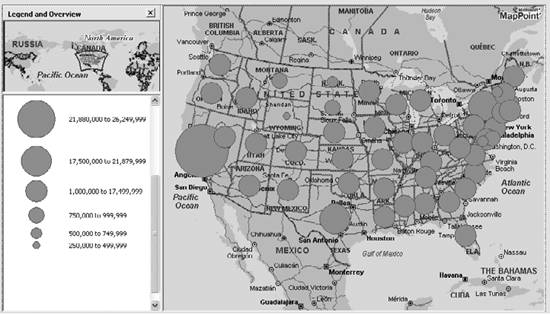 3.3.2.4. Customizing the legend paneYou can customize the legend pane names by defining an array of custom names. The number of the custom name array must be equal to the data range count. In our example the range count is set to eight, so we need to define an array of objects of size eight and assign names for each range: //Define custom name array to reflect //their populations object[] arrayOfcustomNames = new object[8]; arrayOfcustomNames[0] = "Hello! Anyone home?"; arrayOfcustomNames[1] = "Small and happy!"; arrayOfcustomNames[2] = "Nice and pleasant."; arrayOfcustomNames[3] = "Have room for some more!"; arrayOfcustomNames[4] = "Just about the right size."; arrayOfcustomNames[5] = "Still not bad to live here!"; arrayOfcustomNames[6] = "Kind of stuffy here."; arrayOfcustomNames[7] = "Man, too crowded!"; Calling the DisplayDataMap method with custom names results in the map shown in Figure 3-14. The legend pane now contains custom names. They may look (and sound) funny. If you are thinking, "How can you judge whether a state is too crowded based only on population? We're supposed to look at the population density to determine whether it is too crowded or not," these are the exactly right questions to ask. I should display population density (population divided by area of the state) to justify my custom labels. We need to write code to use the DivideBy field. Figure 3-14. Sized circle population map with custom legend pane 3.3.2.5. Using the DivideBy fieldTo create a population density map, you need to divide the population by the total area of the corresponding state. The area of the state is available in the demographic data of the "Area in Square Miles" field. To divide the state population with area, we have only to obtain a reference to the "Area in Square Miles" field and pass it as a DivideByField argument: //Define data field indexes object popIndex = "Population (2002)"; object areaIndex = "Area in Square Miles"; //Get demographic dataset MapPoint.DataSet dataset = map.DataSets.GetDemographics(MapPoint.GeoCountry.geoCountryUnitedStates); //Get population field MapPoint.Field datafield = dataset.Fields.get_Item(ref popIndex); //Get area field MapPoint.Field divideField = dataset.Fields.get_Item(ref areaIndex); ... //Define custom range values //Since the range count is 8, //we are defining 9 range objects object[] arrayOfCustomValues = new object[9]; //Set the custom range values arrayOfCustomValues[0] = 1; arrayOfCustomValues[1] = 5; arrayOfCustomValues[2] = 10; arrayOfCustomValues[3] = 50; //Set the maximum value arrayOfCustomValues[8] = 10000; ... //Now display Map MapPoint.DataMap datamap = dataset.DisplayDataMap(MapPoint.GeoDataMapType.geoDataMapTypeSizedCircle, datafield, MapPoint.GeoShowDataBy.geoShowByRegion1, MapPoint.GeoCombineDataBy.geoCombineByNone, MapPoint.GeoDataRangeType.geoRangeTypeDiscreteEqualRanges, MapPoint.GeoDataRangeOrder.geoRangeOrderHighToLow, colorScheme,rangeCount, arrayOfCustomValues, arrayOfcustomNames, divideField, missing, missing); //Set proper legend title datamap.LegendTitle = "State Population Density"; //Zoom to show compelte data map dataset.ZoomTo( ); As you can see from this code, the divideField is the "Area in Square Miles" field from the demographic dataset. Also, notice that I redefined the custom data range value to accommodate the new data values we'll have after the division process. The new concepts that I have included in this code are setting the LegendTitle property of the data map and zooming to the full data map view by calling the ZoomTo method on the dataset object. The resulting data map is shown in Figure 3-15. From the data map in Figure 3-15, you can see that Alaska has the lowest population density at about 1.1 people per square mile. When you zoom in to the east coast, you can tell that Washington D.C has the highest population density at about 1,000 people per square mile. There is one more thing you can do with custom data ranges: filter unwanted data from the data map. 3.3.2.6. Using the custom data range to filter dataBy specifying custom data range values, you can show only states with population densities below 100 people per square mile. //Set the range so that you only show //states with population density //below 100 people/Sq. Mile arrayOfCustomValues[0] = 1; arrayOfCustomValues[1] = 5; arrayOfCustomValues[2] = 10; arrayOfCustomValues[3] = 50; //Set the maximum value arrayOfCustomValues[8] = 100; Figure 3-15. Sized circle population density map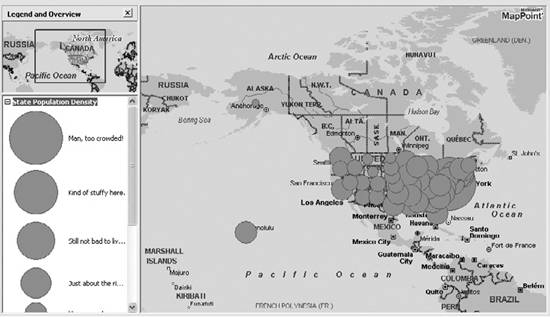 You can also specify any other data range count to achieve the same effect. Finally, to use the Data Mapping Wizard user interface from the MapPoint 2004 product in your application, call the DataSets.ShowDataMappingWizard method: MapPoint.DataMap datamap = map.DataSets.ShowDataMappingWizard(this.Handle.ToInt32( ), null, MapPoint.GeoDataMappingPage.geoDataSetPage); This method takes the parent window handle, a DataSet instance, if you want to import the data into an existing data set and onto the starting page of the wizard. You can pass null if you want to import the data into a new DataSet instance. Next, let's switch gears and look at how to use your business data to draw data maps. |

EAN: 2147483647
Pages: 136