4.10 Debugging
4.10 Debugging
Each of the IDEs listed in this chapter contains debugging facilities. These are a series of IDE options and tools designed to make tracking run-time errors simpler. Using breakpoints, programmers can mark points in their source code where execution will pause (not terminate). A programmer can then examine the state of an application at that point and prompt the program to either continue or terminate as appropriate. It is also possible for programmers to step through a program, line by line or from breakpoint to breakpoint, so as many areas as required can be examined during the course of program execution.
4.10.1 Debugging on Visual Studio .NET
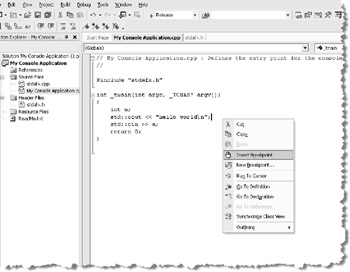
To mark a breakpoint, click the right mouse button on a line where execution is to pause and select Insert Breakpoint.

Figure 4.17
To step through the code line by line, press F11 or click Debug | Step Into.
4.10.2 Debugging on Code::Blocks
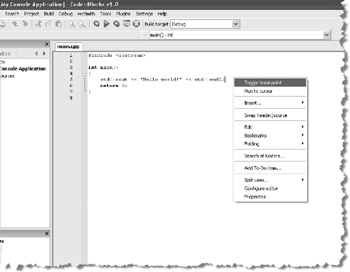
To mark a breakpoint, click the right mouse button on a line where execution is to pause and select Toggle Breakpoint.
To step through the code line by line, press Shift+F7 or click Debug | Step Into.

Figure 4.18
4.10.3 Debugging on Dev C++
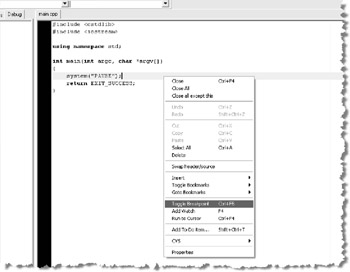
To mark a breakpoint, click the right mouse button on a line where execution is to pause and select Toggle Breakpoint.

Figure 4.19
To step through the code line by line, press Shift+F7 or click Debug | Step Into.
EAN: 2147483647
Pages: 225