Memory Management
| < Day Day Up > |
| As you have seen throughout this book, it's always best to have MySQL perform database operations within memory as often as possible, rather than initiate more expensive disk access. The following sections look at some of the available variables that you can stipulate to determine your server's memory behavior, as well as some general-purpose MySQL memory functionality. Locking mysqld in MemoryAs an administrator, you have the option to force the mysqld process to remain in memory, rather than face the possibility of swapping to disk should system resources become scarce. Typically, you detect this problem via your operating system monitoring tools, which report page faults or other indicators of memory issues. To lock mysqld in memory, launch it with the --memlock option enabled. However, two conditions need to be met or this won't happen:
Finally, by forcing mysqld to remain resident in memory, you introduce the prospect of other performance problems because a significant amount of RAM is now unavailable to other processes. It's a better idea to first investigate why the swapping is happening: Is the amount of memory currently installed on your server simply insufficient for the tasks at hand? Thread Memory SettingsThreads are the internal process mechanisms that MySQL uses to perform work as well as communicate with connected clients. You can control a few settings, but it's quite likely that the default values are fine for most applications. First, to determine your current thread status, use SHOW STATUS: mysql> SHOW STATUS LIKE '%THREAD%'; +------------------------+-------+ | Variable_name | Value | +------------------------+-------+ | Delayed_insert_threads | 4 | | Slow_launch_threads | 0 | | Threads_cached | 9 | | Threads_connected | 27 | | Threads_created | 30 | | Threads_running | 18 | +------------------------+-------+ To see what all your threads are doing, run SHOW PROCESSLIST or view MySQL Administrator's Threads tab, as shown in Figure 10.2. Figure 10.2. Active connection threads as reported by the MySQL Administrator. Threads consume memory in several ways. The thread_stack variable specifies the amount of memory that each thread will be granted when it is started. Generally, this should be left alone. Administrators have another option with the thread_cache_size parameter: It specifies how many threads should be left alive and in the cache to service new connections. Because there is a time and memory cost to creating new threads, you might consider boosting this value if your environment involves frequent new connections. For example, suppose that you are building a web server driven application that typically sees numerous, short lived database connections. Over time, you find that the values in both the tHReads_created and connections server status variables are growing quickly. This means that your thread cache is insufficient; new threads are being created very often. Raising the thread_cache_size setting might reduce some of this server overhead. However, as you will see in Chapter 14, "Operating System, Web Server and Connectivity Tuning," it's an even better idea to figure out ways to reduce the number of database connection starts/stops; perhaps these connections can be pooled among multiple processes. Finally, if you're running MySQL in a Solaris environment, you can use thread_concurrency to affect the operating system's thread consumption behavior. If you are running another operating system, you won't even see this variable. MEMORY TablesAs you saw in Chapter 4, "Designing for Speed," on the MySQL storage engines, MEMORY (previously known as HEAP) tables are very fast, in-memory storage available for developers who need these capabilities. These tables are also used by MySQL itself for many smaller temporary tables. As an administrator, you can decide how much memory you want to allocate for developer-generated tables by setting the max_heap_table_size variable. This value, measured in bytes, tells MySQL how large one of these tables can become. How can you tell if you need to raise this value? A good way to make this decision is to see if any of your applications receive the following kind of error: The table 'message_buffer_mem' is full,S1000,1114 For server-generated temporary tables, use the tmp_table_size setting instead. It also tells MySQL how many bytes a temporary table can consume in memory before being swapped out to a disk-based, MyISAM temporary table. These disk-based tables are obviously much slower than memory-based tables. When setting these values, be careful not to give MySQL too much leeway: Memory is never free, and you might crowd out other system processes by consuming too much for your user and server-requested MEMORY tables. CachingBefore discussing MySQL's general-purpose caching mechanisms, it's worthwhile to understand the differences among four crucial MySQL in-memory caches:
Query Cache OverviewAs you first learned in Chapter 7, "Indexing Strategies," each of MySQL's main storage engines (MyISAM and InnoDB) provides caches to hold index key values. For MyISAM, this cache is known as the key cache; the corresponding structure for InnoDB is the buffer pool, which also caches data. MySQL also offers an optional, cross-engine query cache to buffer frequently submitted queries, along with their resultsets. If the cache is enabled, MySQL first consults the query cache and might find that the query and its results are already resident in memory. Because memory access is always faster than disk access, finding results in the query cache translates into significantly faster performance. It's important to understand that many types of events either block usage of the query cache or cause it to be refreshed with new data the next time a query is run. Four very recurrent events include the following:
Despite all of these possible interruptions, the query cache is still very beneficial for performance. This is especially true if you want to improve response for queries that read relatively stable tables, such as those that provide lookup values or perform validation. You can track the number of times that MySQL has been able to read from the query cache by consulting the qcache_hits status variable. The following sections explore how to enable, configure, and use the query cache. Enabling the Query CacheTo begin, you must determine if your version of MySQL supports query caching: mysql> SHOW VARIABLES LIKE 'HAVE_QUERY_CACHE'; +------------------+-------+ | Variable_name | Value | +------------------+-------+ | have_query_cache | YES | +------------------+-------+ In this example, the version of MySQL does support query caching, so you can now proceed to instruct MySQL to turn on the query cache. You do so by specifying a value for query_cache_size, either via SET GLOBAL or by including it in the MySQL configuration file: SET GLOBAL VARIABLE query_cache_size = (64*1024*1024); or [mysqld] Query_cache_size = 64M If query_cache_size is set to zero, the query cache is disabled. You'll discover how to determine a value for this variable in a moment. Your next decision is when you want queries to use the query cache. You have three choices when setting the query_cache_type system variable:
You have the ability to set this behavior at the GLOBAL and SESSION level, which provides added flexibility. Finally, note that you can enable and configure all variables for the query cache through the MySQL Administrator, as shown in Figure 10.3. Figure 10.3. Configuring query cache variables through the MySQL Administrator.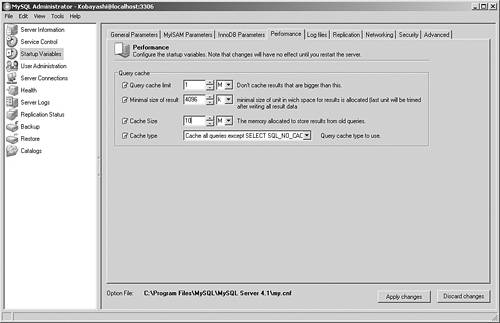 Configuring the Query CacheAfter you've decided to enable the query cache, the next step is to pick a value for the amount of memory to allocate for caching. Whatever value you decide upon, the query_cache_size setting is where you specify your choice. As with most memory settings, this is an art, not a science. You must balance the benefits of caching within the hard limits of available system memory, as well as consider the expected processing profile and load for the database server, all the while keeping in mind that performance can suffer if you excessively over- or underallocate memory. Making this decision even harder are the memory requirements of the MyISAM key cache combined with those of the InnoDB buffer pool three caches all competing for the same scarce memory. In this situation, it's probably wisest to begin by allotting the smallest portion of memory for the query cache between 5% and 10% of your system's memory. However, it's likely that you'll need to tune this number based on the real-world usage of your MySQL system. See the next section for more details on how to monitor important query cache statistics. Your next decision is to determine the maximum amount of memory that you want to allocate within the query cache for an individual query's resultset. Queries with result sets larger than query_cache_limit will not be cached. Given the dynamic nature of the query cache's contents, the default of 1MB might be too large for many installations. If you are in the mood for tinkering with some of the more esoteric query cache variables, a number of potential candidates are available for experimentation. First, you can tune the internal buffers that MySQL uses to analyze, process, and store the queries whose results are then placed in the query cache. The query_prealloc_size variable sets the size of this buffer, whereas the query_alloc_block_size variable tells MySQL what size building blocks it should use to make up this buffer. Both variables are usually fine with their defaults, but you can tune them upward if your queries are so large and/or complex that MySQL would otherwise be forced to perform an expensive memory allocation in the middle of parsing the query. Next, you can tune the default block size that MySQL will use when allocating additional storage in the query cache. Think of the query cache as being constructed of chunks of memory in units of query_cache_min_res_unit. The default for this variable is 4KB. Although this setting should be sufficient for most environments, you can elect to raise it if the typical resultset is large or lower it if it's the opposite. Monitoring the Query CacheYou have several methods at your disposal when monitoring the status of your query cache. Because a picture is worth a thousand words, the MySQL Administrator is the best tool to help you tune your query cache. Alternatively, you can combine the SHOW PROCESSLIST and SHOW VARIABLES commands to get an idea about what is happening. Take a look at a few sample reports to get an idea about how to tune the query cache. To make the most of these reports, output from the MySQL Administrator is combined along with SHOW VARIABLES. Figure 10.4 appears to have a well-performing query cache (which has been defined with a query_cache_size of 16MB). mysql> SHOW STATUS LIKE 'qcache%'; +-------------------------+----------+ | Variable_name | Value | +-------------------------+----------+ | Qcache_free_blocks | 139 | | Qcache_free_memory | 15667648 | | Qcache_hits | 9057 | | Qcache_inserts | 2490 | | Qcache_lowmem_prunes | 0 | | Qcache_not_cached | 0 | | Qcache_queries_in_cache | 1073 | | Qcache_total_blocks | 2289 | +-------------------------+----------+ Figure 10.4. Well-performing query cache activity as reported by the MySQL Administrator.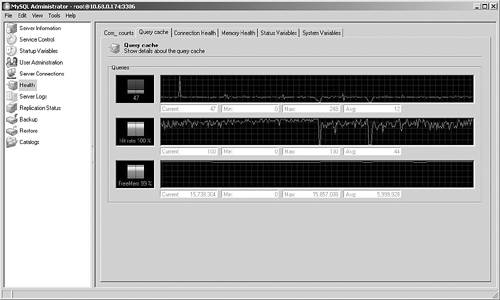 How do you know that this is a well-performing query cache? There are several good indicators:
Unfortunately, something seems to have gone wrong in the second scenario, as shown in Figure 10.5. mysql> SHOW STATUS LIKE 'qcache%'; +-------------------------+---------+ | Variable_name | Value | +-------------------------+---------+ | Qcache_free_blocks | 189 | | Qcache_free_memory | 1915104 | | Qcache_hits | 9851 | | Qcache_inserts | 21227 | | Qcache_lowmem_prunes | 6098 | | Qcache_not_cached | 2744 | | Qcache_queries_in_cache | 344 | | Qcache_total_blocks | 1505 | +-------------------------+---------+ Figure 10.5. Degraded query cache performance as reported by the MySQL Administrator.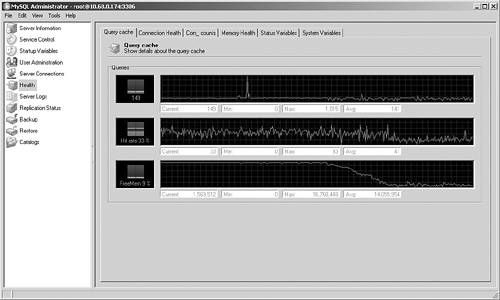 What happened? Basically, this is a different processing profile. What started out (on the left of the graph) as a high-hit rate deteriorated as new connections came online. These connections both queried and updated large blocks of data in a number of tables. This had the effect of lowering the hit rate while increasing the amount of overhead that MySQL had to perform to find new space in the query cache: Note the high Qcache_lowmem_prunes value. How could you make this situation better? You could add more memory to the query cache, but given the widely fluctuating query cache memory requirements of the application, it's quite likely that you would still see frequent query cache refreshes. Plus, you might waste precious memory at the same time. A better idea is to try to identify those queries that are not likely to be able to take advantage of the query cache, and add SQL_NO_CACHE to their SELECT statements. By making that change, you save the query cache for only those queries that can benefit, as shown in Figure 10.6. mysql> SHOW STATUS LIKE 'qcache%'; +-------------------------+----------+ | Variable_name | Value | +-------------------------+----------+ | Qcache_free_blocks | 48 | | Qcache_free_memory | 16143808 | | Qcache_hits | 3953 | | Qcache_inserts | 5110 | | Qcache_lowmem_prunes | 0 | | Qcache_not_cached | 2861 | | Qcache_queries_in_cache | 608 | | Qcache_total_blocks | 1268 | +-------------------------+----------+ Figure 10.6. Query cache performance for a better-selected set of queries as reported by the MySQL Administrator.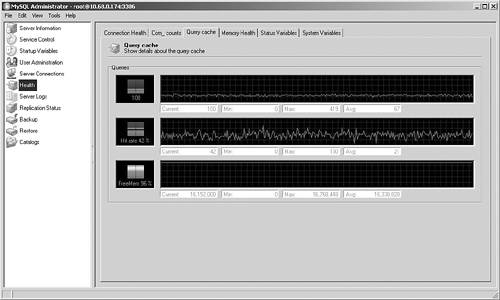 The query cache hit rate is lower, but that's because many queries are not even bothering to work with the query cache, as evidenced by the Qcache_not_cached status indicator. Finally, given the large amount of free memory (Qcache_free_memory), you could probably safely give some back to the operating system. Improving Table Scan PerformanceAs you saw earlier, table scans can be extremely expensive because MySQL must read each row to determine its results. In most cases, your goal should be to avoid them whenever possible. Unfortunately, this isn't always feasible, so to help boost performance in these situations, try tuning the read_buffer_size variable to reduce the number of time-consuming disk-seeks required for queries. It's important to note, however, that MySQL uses the GLOBAL setting to allocate this memory to every thread that performs a sequential scan, whether the table has a thousand rows or a billion rows. It's not hard to imagine a scenario in which many connections are performing sequential scans through small tables, yet allocating (and wasting) large amounts of read_buffer_size memory. To be safe, try keeping this number reasonably low for the GLOBAL setting, and make it as large (or small) as necessary for the individual connection via the SESSION setting. Improving Join PerformanceChapter 7, which was dedicated to making the most of your indexes, discussed why you should always place indexes on your join columns. However, there might be circumstances when you don't have an available index to speed a join. As an alternative, you can use the join_buffer_size setting to request that each MySQL thread that works to process a nonindexed join set aside memory to help finish the join as fast as possible, with multiple join buffers set up when there are multiple nonindexed joins in a query. Improving Sort PerformanceSorting large blocks of information via ORDER BY or GROUP BY can consume significant amounts of system resources. To help MySQL perform these operations in memory, specify a value for the sort_buffer_size variable. Each MySQL thread that is tasked with completing one of these tasks will request this many bytes from memory. To test the impact of changing this parameter, we created a sample table to hold monetary transactions, as well as another identical table to receive extracted rows from our transaction table: CREATE TABLE transactions ( transaction_id INT UNSIGNED NOT NULL, transaction_DATE NOT NULL, customer_id INT NOT NULL, amount DECIMAL(5,2) NOT NULL, transaction_type ENUM ('Purchase','Credit') ) ENGINE = MYISAM; CREATE TABLE transaction_extract LIKE transactions; Next, we loaded more than 21 million rows of random data into the transactions table. Finally, we created a simple query to place a sorting load on the engine: INSERT INTO transaction_extract SELECT * FROM transactions ORDER BY amount; We ran multiple tests, varying sort_buffer_size from 256K all the way up to 25MB. To ensure accuracy, we stopped and started the mysqld process between tests. The results were conclusive, but not tremendously dramatic: The 25MB sort_buffer_size concluded approximately 25% faster than the 256K setting. However, look at some key status variables: 256K setting: Sort_merge_passes 216 Sort_rows 21195536 Sort_scan 1 25-MB setting: Sort_merge_passes 1 Sort_rows 21195536 Sort_scan 1 Allocating a bigger sort_buffer_size saved 215 merge passes for the sort algorithm, while everything else was identical between the two tests. In your own environment, a large (or rapidly growing) sort_merge_passes server status indicates that you should probably boost sort_buffer_size. After the sort has been completed, MySQL uses the read_rnd_buffer_size variable to determine how much memory to allocate to finish processing the results. Before you get tempted to raise this value sky-high, remember that MySQL will apportion this memory to all clients, regardless of their sorting needs. As with the read_buffer_size variable discussed earlier, it's wiser to make the GLOBAL setting small, and raise it as necessary for any appropriate SESSION. Binary Log and CachingRecall that the binary log serves many purposes, including essential support for transactions and replication. To help improve performance, MySQL sets up a binary log cache for every connected client. As an administrator, you can configure the size of this buffer by setting the binlog_cache_size variable, which is applicable at the GLOBAL level. How do you know if you have sized this variable correctly? Keep an eye on both the binlog_cache_use and binlog_cache_disk_use status variables: They count the number of times that your transactions were able to use the binary log cache and the number of times that the size of the transaction forced the creation of a relatively expensive temporary table. Your goal should be to keep the count of binlog_cache_disk_use as low as possible. If necessary, you can also configure a not-to-exceed value for your binary log cache by specifying max_binlog_cache_size. However, the default of 4GB is probably sufficient for most environments. You also have control over the binary log's internal memory structures for tracking transaction requests, via the transaction_alloc_block_size and transaction_prealloc_size. The former variable defines the memory block size for storing information about queries that participate in transactions, whereas the latter assigns an amount of memory that remains dedicated to this buffer after a query completes. One final note about tuning binary log performance: You can stipulate how frequently the log is synchronized to disk. Remember that for a number of reasons, not the least of which is performance, MySQL performs binary log operations in memory, and then makes these operations permanent by synchronizing them to disk. Administrators face a perennial dilemma: How should they balance the integrity benefits of frequent synchronization with the costs of these disk-based operations? Whatever your decision, use the sync_binlog GLOBAL server variable to instruct MySQL on how often to make these synchronizations. Values range from zero, meaning never synchronize, to one, meaning synchronize after each binary log change in memory, to higher numbers. For example, setting it to 10 means that synchronization will happen after the tenth write to the in-memory log. Generally, it's wise to set this to one; the potential for minor performance degradation is not as costly as the possibility of lost data should the server crash prior to a disk synchronization. |
| < Day Day Up > |
EAN: 2147483647
Pages: 131
- Chapter I e-Search: A Conceptual Framework of Online Consumer Behavior
- Chapter II Information Search on the Internet: A Causal Model
- Chapter IV How Consumers Think About Interactive Aspects of Web Advertising
- Chapter VII Objective and Perceived Complexity and Their Impacts on Internet Communication
- Chapter XIV Product Catalog and Shopping Cart Effective Design