Qualifying Risks - The Third Step
|
Qualifying Risks—The Third Step
Qualifying risks involves three components or substeps—filtering the risk to determine if it actually is a risk and when it is likely to occur during the project life cycle, determining the probability that a risk event will occur, and prioritizing the risk.
Risk Filtering
Once a list is developed, each risk is filtered to determine whether it is within project scope, if it is likely to occur, what its significance is, when it might occur within the project life cycle, and even if it is a real risk. It is not uncommon to identify a potential risk only to decide after careful deliberation that it is not a risk at all, or, if it is a risk, that the consequences of the impact are so small as to not be a concern. The best method for assessing risks is through a process of filtering, as the one shown in Exhibit 7-5. It is important not to prioritize risks at this stage. At this point of the analysis, the objective is to determine risk characteristics.
Exhibit 7-5: The risk-filtering process.
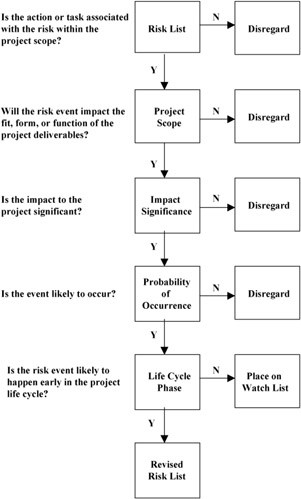
Many times a perceived risk is often not a risk when measured against the project scope. If the action generating the perceived risk is not within the scope, then it is not a risk and can be ignored.
Filtering the list developed during risk identification results in a final or revised risk list. The next step is to determine the probability of risk event occurrence. Whenever possible, it is better to assign a percentage probability to the risk. This is because the next step of the risk analysis process is to quantify the risk or measure the relative importance of one risk over another.
It is not always possible to assign a percentage probability when you lack historical data or experience. In those cases, the best that can be done is to assign a low, medium, or high probability of risk. Even in that case, a range of numerical values may be possible, as shown in Exhibit 7-6. Even taking the middle of the range, or being pessimistic and taking the high end of the range, provides a numerical result for a better comparison. The importance of assigning a percentage probability to the risk will become clear in the discussion on quantifying risks.
Exhibit 7-6: Changing subjective ratings into percentages.
| Risks | Very Low 0–5% | Low 6–15% | Medium 16–40% | High 41–80% | Very High 81–100% |
|---|---|---|---|---|---|
Prioritizing Risk
The risk-filtering step should result in a revised list of risks that accurately represent the most likely risk events to expect during a project's life cycle. Although it is important to identify potential risks, it is absolutely crucial to prioritize them. One serious mistake project managers make is to attempt to manage all risks on the revised list. Fortunately, that is not necessary because the reality is that we can manage about ten risks at a time. Hence, for greater efficiency and effectiveness, a list of the top ten risks should be actively managed with a watch list of the remainder to replace those that are mitigated, controlled, or eliminated, or that don't materialize. One of the best and easiest ways of prioritizing risks is with some form of a comparative ranking method. Exhibit 7-7 illustrates one such method.
Exhibit 7-7: Comparative risk-ranking form.
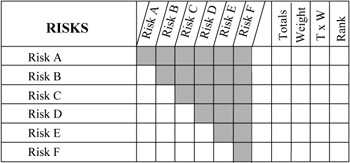
Comparative ranking methods simply compare each risk against every other risk to determine its relative importance. Ranking is usually determined through voting and is best done as a team effort. The form in Exhibit 7-7 also provides for the application of a weighting factor to each of the risks. Organizations are either risk-prone, that is, willing to take more risks, or risk-adverse, unwilling to take much risk. The team will, therefore, assign a weighting factor to each type of risk to take into account the corporate risk-taking culture.
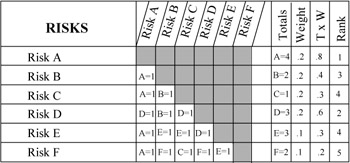
To use the comparative risk ranking form, the risks, A through F in our example, are listed down the left-hand side and across the top of the form. Then each risk is compared against every other risk in turn. If Risk A is considered more important, in terms of impact to the project, than Risk B, then in the square at the intersection of Risks A and B, write A = 1, as shown in Exhibit 7-8. Continue the process until every risk has been compared against every other risk. Total the scores for each risk (as shown in Exhibit 7-9) and apply any weighting factors. The final ranking is shown in the last column. If each risk is considered to be of equal weight, then the scores will determine the relative ranking.
Exhibit 7-8: Risk comparisons.
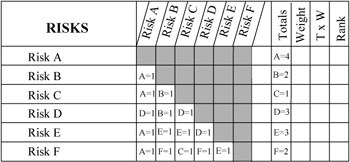
Exhibit 7-9: Weighted risk comparisons.
|
EAN: 2147483647
Pages: 129