Section 9.4. Graphics
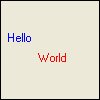
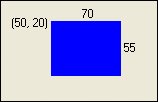
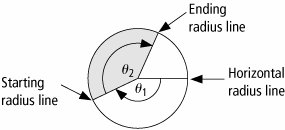
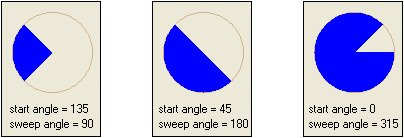
9.4. GraphicsIn this section, we draw bar charts and pie charts in a picture box, and illustrate one method for creating animation on a form. Graphics ObjectsA statement of the form Dim gr As Graphics = picBox.CreateGraphicsdeclares gr to be a Graphics object for the picture box picBox. The unit of measurement used in graphics methods is the pixel. To get a feel for how big a pixel is, the title bar of a form is 30 pixels high, and the border of a form is four pixels thick. The setting for the Size property of a picture box is two numbers separated by a comma. The two numbers give the width and height of the picture box in pixels. You can alter these numbers to specify a precise size. Each point of a picture box is identified by a pair of coordinates (x, y)where x (between 0 and picBox.Width) is its distance in pixels from the left side of the picture box, and y (between 0 and picBox.Height) is its distance in pixels from the top of the picture box. Text is placed in a picture box with a statement of the form gr.DrawString(string, Me.Font, Brushes.Color, x, y) where string is either a string variable or literal, Me.Font specifies that the Form's font be used to display the text, and the upper-left corner of the first character of the text has coordinates (x, y). The color of the text is determined by Color. IntelliSense will provide a list of about 140 possible colors after "Brushes." is typed. As an example, the statements Dim gr As Graphics = picBox.CreateGraphics Dim strVar As String = "Hello" gr.DrawString(strVar, Me.Font, Brushes.Blue, 4, 30) gr.DrawString("World", Me.Font, Brushes.Red, 35, 50) produce the output shown in Figure 9.17 Figure 9.17. DrawString method. Lines, Rectangles, Circles, and SectorsLet gr be a graphics object for picBox. Then the statement gr.DrawLine(Pens.Color, x1, y1, x2, y2) draws a straight line segment from the point with coordinates (x1, y1) to the point with coordinates (x2, y2). The color of the line is determined by Color. IntelliSense will provide an extensive list of possible colors after "Pens." is typed. For instance, the statement gr.DrawLine(Pens.Blue, 50, 20, 120, 75)draws a blue line from the point with coordinates (50, 20) to the point with coordinates (120, 75). See Figure 9.18 Figure 9.18. DrawLine method. The statement gr.FillRectangle(Brushes.Color, x, y, w, h) draws a solid rectangle of width w and height h in the color specified and having the point with coordinates (x, y) as its upper-left vertex. For instance, the statement gr.FillRectangle(Brushes.Blue, 50, 20, 70, 55) draws the rectangle shown in Figure 9.19 Figure 9.19. FillRectangle method. The FillEllipse method draws a solid ellipse of a specified color, given the specifications of a circumscribed rectangle. The rectangle is specified by the coordinates of its upper-left point, its width, and its height. This method produces a circle when the width and height of the rectangle are the same. In particular, the statement gr.FillEllipse(Brushes.Color, x - r, y - r, 2 * r, 2 * r) draws a solid circle of the specified color with center (x, y) and radius r. For instance, the statement gr.FillEllipse(Brushes.Blue, 80 - 40, 50 - 40, 2 * 40, 2 * 40) draws a solid blue circle with center (80, 50) and radius 40. Note: If a rectangle were circumscribed about the circle, the rectangle would be a square with its upper-left vertex at (40, 10) and each side of length 80. The FillPie method draws a solid sector of an ellipse in a color. The ellipse is specified by giving the coordinates, width, and height for the circumscribing rectangle, as in the FillEllipse method. The sector is determined by a radius line and the angle swept out by the radius line. We are interested solely in the case where the ellipse is a circle. The shaded region in Figure 9.20 is a typical sector (or pie shaped region) of a circle. The sector is determined by the two angles q1 and q2. The start angle, q1, is the angle through which the horizontal radius line must be rotated clockwise to reach the starting radius line of the sector. Angle q2 is the number of degrees through which the starting radius line must sweep (clockwise) to reach the ending radius line of the sector. The angles q1 and q2 are referred to as the start angle and the sweep angle, respectively. Figure 9.21 shows the start and sweep angles for three sectors. Figure 9.20. A typical sector of a circle. Figure 9.21. FillPie method. The Brushes, Pens, and Fonts appearing in the drawing statements so far are literals of objects. Variables also can be used to provide these values. For instance, the statement gr.FillRectangle(Brushes.Blue, 50, 20, 70, 55) can be replaced by the pair of statements Dim br As Brush = Brushes.Blue gr.FillRectangle(br, 50, 20, 70, 55) The first statement declares br to be a variable of type Brush and assigns it the value Brushes.Blue. Numeric variables used in the Draw and Fill statements discussed in this section must be of type Integer or Single. The Single data type is similar to the Double data type, but has a smaller range. A variable of type Single can hold whole numbers, fractional, or mixed number between about -3.4.1038 and 3.4.1038. The CSng function converts other data types to the Single data type. Pie ChartsConsider the three pieces of data in Table 9.1. A pie chart can be used to graphically display the relative sizes of these numbers. The first step in creating a pie chart is to convert the numbers to percents. Since the total expenditures are $419 billion, the federal outlay is 33/419 Figure 9.22. Pie chart for Example 1.
The blue sector in Figure 9.22 has start angle 0 and sweep angle .08*360. The red sector has start angle .08*360 and sweep angle .49*360. The tan sector has start angle .08*360+.49*360 [or(.08+.49)*360] and sweep angle .43*360. Notice that each start angle is (sum of previous percentages)*360. The sweep angle for each sector is the corresponding percentage times 360. Example 1. |
| The following program creates the pie chart (see Figure 9.22) for the financing of public schools. The program is written so that it can be easily converted to handle a pie chart with up to six sectors. All that is required is to change the first two Dim statements and the Me.Text statement. The "Dim br() As Brush" line, which creates an array of brushes, has six brushes in order to accommodate additional sectors. Private Sub btnDisplay_Click(...) Handles btnDisplay.Click Dim legend() As String = {"Federal", "State", "Local"} Dim quantity() As Single = {33, 206, 180} Dim percent(quantity.GetUpperBound(0)) As Single |
Bar Charts
Our goal here is to produce the bar chart of Figure 9.23. The picture box for the chart has a width of 210 and height of 150 pixels. (Here, the BorderStyle property is set to FixedSingle for instructional reasons. In general, the bar chart will look better with the BorderStyle property left at its default setting: None.)
Figure 9.23. Bar chart for Example 2.
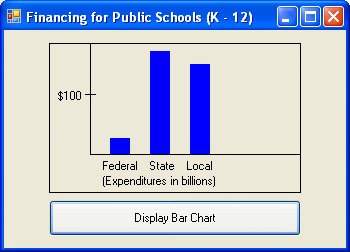
The three magnitudes for the graph are 33, 206, and 180. If we let a pixel correspond to one unit, then the largest rectangle will be 206 pixels higha bit too large. With a pixel corresponding to 2 units, the largest rectangle will be 206 / 2 or 103 pixels higha reasonable size. By setting the x-axis 110 pixels from the top of the picture box, the largest rectangle is accomodated comfortably. The top of the largest rectangle is 110 - 103 [that is, 100 - (206/2)] pixels from the top of the picture box. In general, a rectangle corresponding to the quantity q will be 110 - (q/2) pixels from the top of the picture box, and the height will be q / 2 pixels.
Example 2.
| The following program produces the bar chart of Figure 9.23. Each rectangle is 20 pixels wide, and there are 20 pixels between rectangles. Private Sub btnDisplay_Click(...) Handles btnDisplay.Click Dim quantity() As Single = {33, 206, 180} Dim gr As Graphics = picOutput.CreateGraphics 'The picture box has width 210 and height 150 gr.DrawLine(Pens.Black, 40, 110, picOutput.Width, 110) 'Draw x-axis gr.DrawLine(Pens.Black, 40, 110, 40, 0) 'Draw y-axis gr.DrawLine(Pens.Black, 35, 100 / 2, 45, 100 / 2) 'Draw tick mark gr.DrawString("$100", Me.Font, Brushes.Black, 5, 45) Me.Text = "Financing for Public Schools (K - 12)" For i As Integer = 0 To quantity.GetUpperBound(0) gr.FillRectangle(Brushes.Blue, 60 + i * 40, _ (110 - quantity(i) / 2), 20, quantity(i) / 2) Next gr.DrawString("Federal State Local", Me.Font, _ Brushes.Black, 50, 115) gr.DrawString("(Expenditures in billions)", Me.Font, _ Brushes.Black, 50, 130) End Sub |
Animation
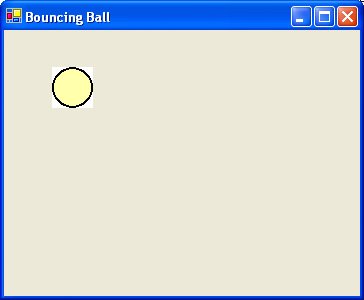
One way to produce animation on a form is to place an image into a picture box and then move the picture by steadily changing the location of the picture box. Figure 9.24 shows a ball placed inside a small picture box.
Figure 9.24. The form for Example 3. (This item is displayed on page 503 in the print version)
Object | Property | Setting |
|---|---|---|
frmBall | Text | Bouncing Ball |
picBall | Image | MOON5.BMP |
Timer1 | Interval | 10 |
Example 3. (This item is displayed on pages 502 - 503 in the print version)
| In the following program, the ball in Figure 9.24 will initially move diagonally in a Southeast direction and then bounce off any side of the form it hits. The client area of a form is the gray area within the title bar and borders of the form. The values of Me.ClientSize.Height and Me.ClientSize.Width are the height and width of the gray area. The values of picBox.Top and picBox.Left are the distances of the picture box from the top and left sides of the client area. The speed at which the ball moves is determined by the setting for the Interval property of Timer1. At each tick, the ball will move x pixels horizontally, where x=1 or -1. When x=1 the ball moves to the right, and when x=-1 the ball moves to the left. The value of x reverses when the ball strikes the right or left side of the form. The value of y determines the vertical motion of the ball in a similar manner, Dim x As Integer = 1 Dim y As Integer = 1 Private Sub frmBall_Load(...) Handles MyBase.Load Timer1.Enabled = True End Sub Private Sub Timer1_Tick(...) Handles Timer1.Tick If picBall.Top <= 0 Or _ picBall.Top >= (Me.ClientSize.Height - picBall.Height) Then x = -x End If picBall.Top += x If picBall.Left <= 0 Or _ picBall.Left >= (Me.ClientSize.Width - picBall.Width) Then y = -y End If picBall.Left += y End Sub |
Comments
A statement of the form
Dim pn As Pen = Pens.Colordeclares pn to be a variable of type Pen and assigns it the value Pens.Color.
A statement of the form
Dim fnt As Font = New Font(fontName, size)declares fnt to be a variable of type Font and assigns it the specified font and size. For instance, the statements
Dim gr As Graphics = picBox.CreateGraphics Dim fnt As Font = New Font("Courier New", 10) gr.DrawString("Hello", fnt, Brushes.Blue, 4, 30)
display the word Hello in 10-point Courier New font.
The statement
picBox.Refresh()clears all graphics and text from the picture box.
The client area of a picture box is the gray area within the borders of the picture box. When the BorderStyle property is set to None, the client area is the entire picture box. When the BorderStyle property is set to FixedSingle, the width and height of the client area are each two pixels less than the width and height of the entire picture box. For instance, if the BorderStyle setting of picBox is FixedSingle, if picBox.Width is 200 and picBox.Height is 100, then picBox.ClientSize.Width is 198 and picBox.ClientSize.Height is 98.
Practice Problems 9.4
| 1. | (True or False) The Draw and Fill methods discussed in this section use colored Brushes. |
| 2. | Suppose the Size property of picBox is "200, 100." Give the lines of code that draw the uppermost and lowermost red horizontal lines possible in the picture box. |
Exercises 9.4
In Exercises 1 through 4, write an event procedure to draw the given figures in a picture box.
| 1. | Draw a circle whose center is located at the center of a picture box. |
| 2. | Draw a circle whose leftmost point is at the center of a picture box. |
| 3. | Use the FillEllipse method to create an unfilled red circle of radius 20. |
| 4. | Draw a triangle with two sides of the same length. |
In Exercises 5 through 8, write a program to create the flag of the designated country. Refer to Figure 9.25 Note: The Swiss flag is square. For the other three flags, the width is 1.5 times the height.
Figure 9.25. Flags of four countries.

| 5. | Italy | ||||||||||||||||||||
| 6. | Switzerland | ||||||||||||||||||||
| 7. | Niger | ||||||||||||||||||||
| 8. | Greenland | ||||||||||||||||||||
| 9. | Write a program to draw displays such at the one in Figure 9.26 Let the user specify the maximum number (in this display, 8). Figure 9.26. Drawing for Exercise 9. | ||||||||||||||||||||
| 10. | Write a program to draw displays such at the one in Figure 9.27 Let the user specify the number of lines (in this display, 3). Figure 9.27. Drawing for Exercise 10. | ||||||||||||||||||||
| 11. | Use the data in Table 9.3 to create a pie chart.
| ||||||||||||||||||||
| 12. | Use the data in Table 9.4 to create a bar chart.
| ||||||||||||||||||||
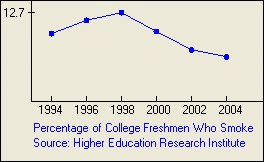
| 13. | Write a program to create the line chart in Figure 9.28 Use the data in Table 9.5. Figure 9.28. Line chart for Exercise 13.
Source: Higher Education Research Institute | ||||||||||||||||||||
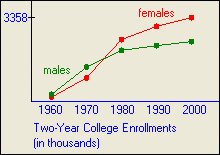
| 14. | Write a program to create the line chart in Figure 9.29 Use the data in Table 9.6 Figure 9.29. Line chart for Exercise 14.
| ||||||||||||||||||||
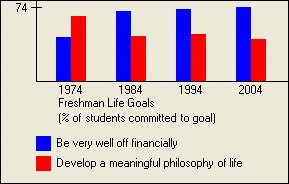
| 15. | Write a program to create the bar chart in Figure 9.30. Figure 9.30. Bar chart for Exercise 15. | ||||||||||||||||||||
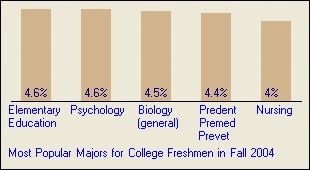
| 16. | Write a program to create the bar chart in Figure 9.31. Use the data in Table 9.7 Figure 9.31. Bar chart for Exercise 16.
Source: Higher Education Research Institute | ||||||||||||||||||||
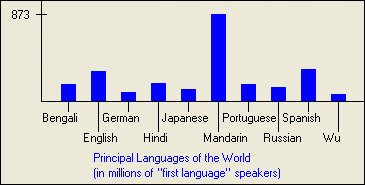
| 17. | Write a program to create the bar chart in Figure 9.32. Use the data in Table 9.8. Note: Mandarin and Wu are spoken primarily in China. Figure 9.32. Bar chart for Exercise 17.
| ||||||||||||||||||||
| 18. | Write a program that allows the user to display a budget as a pie chart. See Figure 9.33 After the user enters numbers into the four text boxes and presses the button, the pie chart should be displayed. Figure 9.33. Form for Exercise 18. | ||||||||||||||||||||
| 19. | Write a program in which an airplane flies horizontally to the right across a form. After it flies off the form, the airplane should reappear on the left and fly horizontally across the screen again. Note: Use the image AIRPLANE.BMP found in the folder Programs\Ch09\Pictures. |
Solutions to Practice Problems 9.4
| 1. | False. Only the Fill methods and the DrawString method use colored Brushes. The DrawLine method uses colored Pens. |
| 2. | If the BorderStyle property of picBox is set to "None," then the following code draws the lines. Note: There are 200 pixels across the top of picBox. They are represented by the numbers 0, 1, 2, ..., 199. Dim gr As Graphics = picBox.CreateGraphics gr.DrawLine(Pens.Red, 0, 0, 199, 0) gr.DrawLine(Pens.Red, 0, 99, 199, 99) If the BorderStyle property of picBox is set to "FixedSingle," then the following code draws the lines. Dim gr As Graphics = picBox.CreateGraphics gr.DrawLine(Pens.Red, 0, 0, 197, 0) gr.DrawLine(Pens.Red, 0, 97, 197, 97) The following code will work with any setting of the BorderStyle property. Dim gr As Graphics = picBox.CreateGraphics gr.DrawLine(Pens.Red, 0, 0, picBox.ClientSize.Width - 1, 0) gr.DrawLine(Pens.Red, 0, picBox.ClientSize.Height - 1, _ picBox.ClientArea.Width - 1, picBox.ClientSize.Height - 1) |
EAN: 2147483647
Pages: 164

 .08 or 8%. Similarly, the state and local expenditures are 49% and 43%. See Table 9.2. Our goal is to write a program to display the information in the pie chart of Figure 9.22

